1009 E Silva St Long Beach, CA 90807
Bixby Knolls NeighborhoodEstimated Value: $871,000 - $909,000
3
Beds
2
Baths
1,211
Sq Ft
$735/Sq Ft
Est. Value
About This Home
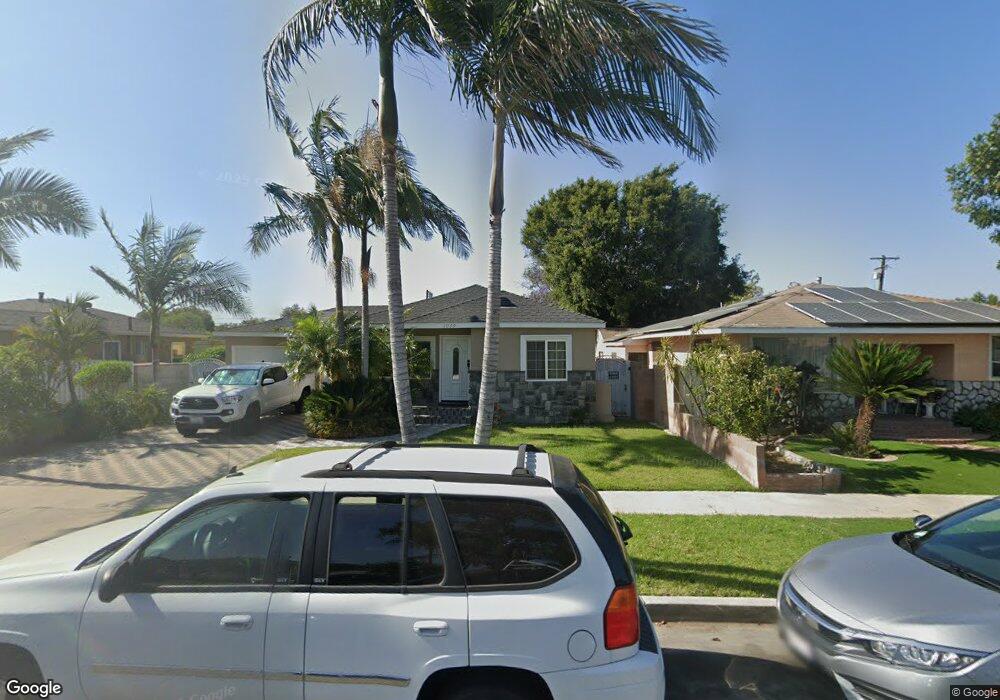
This home is located at 1009 E Silva St, Long Beach, CA 90807 and is currently estimated at $890,587, approximately $735 per square foot. 1009 E Silva St is a home located in Los Angeles County with nearby schools including Barton Elementary School, Lindbergh STEM Academy, and Jordan High School.
Ownership History
Date
Name
Owned For
Owner Type
Purchase Details
Closed on
Dec 2, 2021
Sold by
Rosa Ramirez
Bought by
Rosa Ramirez Family Trust
Current Estimated Value
Purchase Details
Closed on
Jan 27, 2004
Sold by
Gonzalez Garza Llc
Bought by
Ramirez Silvino and Ramirez Rosa
Purchase Details
Closed on
Nov 12, 2003
Sold by
Gonzalez Jaime Dejesus
Bought by
Gonzalez Garza Llc
Purchase Details
Closed on
Aug 8, 2003
Sold by
Violet Katherine Dunn Revocable Trust
Bought by
Gonzales Garza Investments
Home Financials for this Owner
Home Financials are based on the most recent Mortgage that was taken out on this home.
Original Mortgage
$112,000
Interest Rate
5.29%
Mortgage Type
Purchase Money Mortgage
Purchase Details
Closed on
Aug 1, 1995
Sold by
Dunn V Katharine
Bought by
Dunn Violet Katherine and Dunn Violet Katherine
Create a Home Valuation Report for This Property
The Home Valuation Report is an in-depth analysis detailing your home's value as well as a comparison with similar homes in the area
Home Values in the Area
Average Home Value in this Area
Purchase History
| Date | Buyer | Sale Price | Title Company |
|---|---|---|---|
| Rosa Ramirez Family Trust | -- | None Listed On Document | |
| Ramirez Silvino | $395,000 | Ticor Title Insurance | |
| Gonzalez Garza Llc | -- | -- | |
| Gonzalez Jamie Dejesus | -- | -- | |
| Gonzales Garza Investments | $95,000 | Ticor Title Company | |
| Dunn Violet Katherine | -- | -- |
Source: Public Records
Mortgage History
| Date | Status | Borrower | Loan Amount |
|---|---|---|---|
| Previous Owner | Gonzales Garza Investments | $112,000 | |
| Closed | Ramirez Silvino | $0 |
Source: Public Records
Tax History
| Year | Tax Paid | Tax Assessment Tax Assessment Total Assessment is a certain percentage of the fair market value that is determined by local assessors to be the total taxable value of land and additions on the property. | Land | Improvement |
|---|---|---|---|---|
| 2025 | $7,173 | $561,590 | $426,531 | $135,059 |
| 2024 | $7,173 | $550,579 | $418,168 | $132,411 |
| 2023 | $7,052 | $539,784 | $409,969 | $129,815 |
| 2022 | $6,622 | $529,201 | $401,931 | $127,270 |
| 2021 | $6,490 | $518,825 | $394,050 | $124,775 |
| 2019 | $6,396 | $503,438 | $382,363 | $121,075 |
| 2018 | $6,175 | $493,567 | $374,866 | $118,701 |
| 2016 | $5,681 | $474,403 | $360,310 | $114,093 |
| 2015 | $5,452 | $467,278 | $354,898 | $112,380 |
| 2014 | $5,415 | $458,126 | $347,947 | $110,179 |
Source: Public Records
Map
Nearby Homes
- 1124 E Ridgewood St
- 5021 Brayton Ave
- 1071 E 46th St
- 5050 Linden Ave Unit 62
- 5050 Linden Ave Unit 75
- 5050 Linden Ave Unit 97
- 5174 Linden Ave
- 496 E 52nd St
- 472 E Sunset St
- 1414 E Silva St
- 496 E 53rd St
- 5381 Olive Ave
- 400 E Arbor St Unit 1
- 4865 Elm Ave
- 309 E Silva St
- 1709 E Luray St
- 312 E Peace St
- 5131 Gaviota Ave
- 242 E Del Amo Blvd
- 345 E 53rd St
- 1001 E Silva St
- 1017 E Silva St
- 969 E Silva St
- 1025 E Silva St
- 961 E Silva St
- 1033 E Silva St
- 953 E Silva St
- 1041 E Silva St
- 5096 N Bentree Cir
- 1008 E Silva St
- 1000 E Silva St
- 1016 E Silva St
- 968 E Silva St
- 945 E Silva St
- 1024 E Silva St
- 1049 E Silva St
- 960 E Silva St
- 5088 N Bentree Cir
- 1032 E Silva St
- 952 E Silva St
Your Personal Tour Guide
Ask me questions while you tour the home.