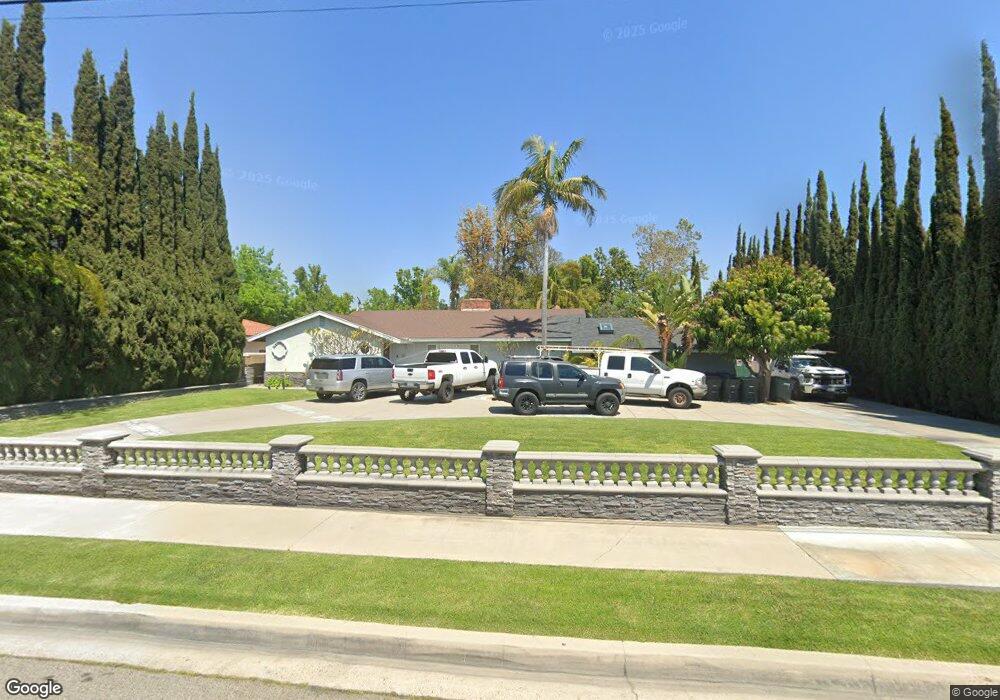
1009 N Shaffer St Orange, CA 92867
Estimated Value: $1,156,000 - $1,565,000
3
Beds
2
Baths
2,445
Sq Ft
$587/Sq Ft
Est. Value
About This Home
This home is located at 1009 N Shaffer St, Orange, CA 92867 and is currently estimated at $1,434,704, approximately $586 per square foot. 1009 N Shaffer St is a home located in Orange County with nearby schools including California iInspire Academy, Yorba Middle School, and Orange High School.
Ownership History
Date
Name
Owned For
Owner Type
Purchase Details
Closed on
Mar 9, 2011
Sold by
Kline Ross Paul and Kline Holly Ann
Bought by
Kline Ross Paul and Kline Holly Ann
Current Estimated Value
Purchase Details
Closed on
Jun 7, 2010
Sold by
Chase Merritt Fund Ii Llc
Bought by
Kline Ross Paul and Kline Holly Ann
Home Financials for this Owner
Home Financials are based on the most recent Mortgage that was taken out on this home.
Original Mortgage
$616,695
Interest Rate
4.52%
Mortgage Type
FHA
Purchase Details
Closed on
Feb 4, 2010
Sold by
Castellanos Ofelia
Bought by
Chase Merritt Fund Ii
Purchase Details
Closed on
Feb 2, 2007
Sold by
Castellanos Ofelia
Bought by
Castellanos Ofelia and The Castellanos Family Trust
Home Financials for this Owner
Home Financials are based on the most recent Mortgage that was taken out on this home.
Original Mortgage
$330,000
Interest Rate
6.17%
Mortgage Type
New Conventional
Create a Home Valuation Report for This Property
The Home Valuation Report is an in-depth analysis detailing your home's value as well as a comparison with similar homes in the area
Home Values in the Area
Average Home Value in this Area
Purchase History
| Date | Buyer | Sale Price | Title Company |
|---|---|---|---|
| Kline Ross Paul | -- | None Available | |
| Kline Ross Paul | $625,000 | First American Title Company | |
| Chase Merritt Fund Ii | $140,000 | First American Title Company | |
| Castellanos Ofelia | -- | Accommodation | |
| Castellanos Ofelia | -- | North American Title Co |
Source: Public Records
Mortgage History
| Date | Status | Borrower | Loan Amount |
|---|---|---|---|
| Previous Owner | Kline Ross Paul | $616,695 | |
| Previous Owner | Castellanos Ofelia | $330,000 |
Source: Public Records
Tax History
| Year | Tax Paid | Tax Assessment Tax Assessment Total Assessment is a certain percentage of the fair market value that is determined by local assessors to be the total taxable value of land and additions on the property. | Land | Improvement |
|---|---|---|---|---|
| 2025 | $8,619 | $800,730 | $523,421 | $277,309 |
| 2024 | $8,619 | $785,030 | $513,158 | $271,872 |
| 2023 | $8,428 | $769,638 | $503,096 | $266,542 |
| 2022 | $8,265 | $754,548 | $493,232 | $261,316 |
| 2021 | $8,032 | $739,753 | $483,560 | $256,193 |
| 2020 | $7,957 | $732,168 | $478,601 | $253,567 |
| 2019 | $7,855 | $717,812 | $469,216 | $248,596 |
| 2018 | $7,734 | $703,738 | $460,016 | $243,722 |
| 2017 | $7,409 | $689,940 | $450,996 | $238,944 |
| 2016 | $7,264 | $676,412 | $442,153 | $234,259 |
| 2015 | $7,158 | $666,252 | $435,511 | $230,741 |
| 2014 | $7,004 | $653,202 | $426,980 | $226,222 |
Source: Public Records
Map
Nearby Homes
- 994 N Cleveland St
- 918 N Cleveland St
- 631 E Elizabeth Dr
- 504 E Barkley Ave
- 622 E Lomita Ave
- 860 N Grand St
- 534 E Hoover Ave
- 201 W Collins Ave Unit 40
- 425 E Everett Place
- 123 E Wilson Ave
- 855 N Lemon St Unit 6
- 1127 E Adams Ave
- 934 E Rose Ave
- 1241 E Mayfair Ave
- 552 N Cambridge St
- 1344 E Mayfair Ave
- 1036 E Trenton Ave
- 1011 E Chestnut Ave
- 355 N Pine St
- 1801 E Collins Ave Unit 36
- 1025 N Shaffer St
- 985 N Shaffer St
- 1006 N Elizabeth Place
- 997 N Orangetree Ln
- 1026 N Elizabeth Place
- 958 N Shaffer St
- 989 N Orangetree Ln
- 1014 N Shaffer St
- 1004 N Shaffer St
- 1041 N Shaffer St
- 1024 N Shaffer St
- 981 N Orangetree Ln
- 994 N Shaffer St
- 971 N Shaffer St
- 1040 N Elizabeth Place
- 1034 N Shaffer St
- 973 N Orangetree Ln
- 420 E Monroe Ave
- 1046 N Shaffer St
- 416 E Monroe Ave
Your Personal Tour Guide
Ask me questions while you tour the home.