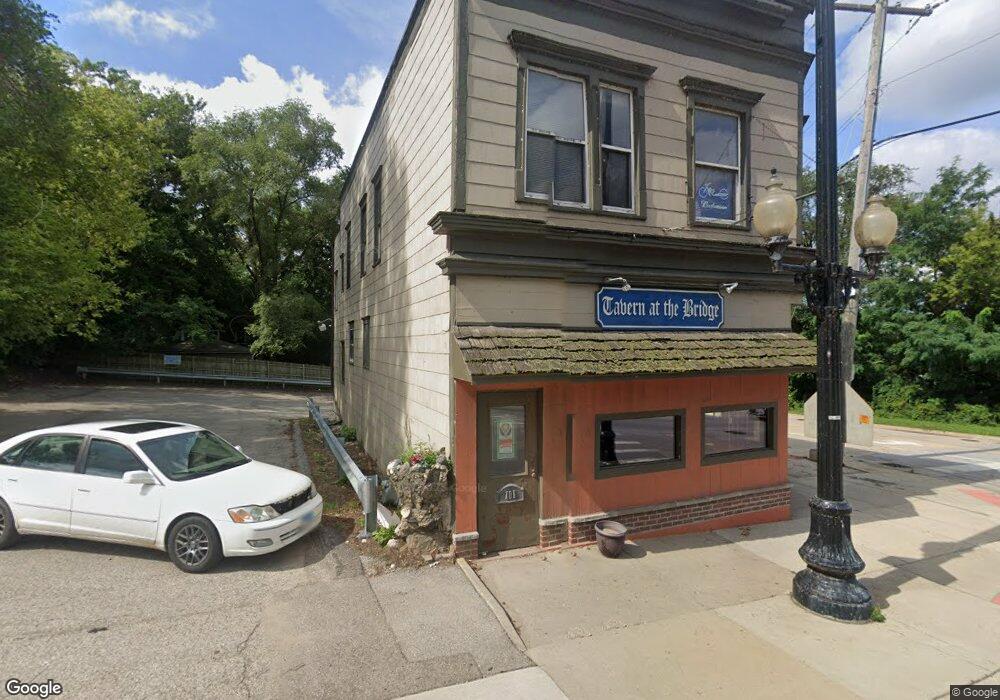
101 E Algonquin Rd Algonquin, IL 60102
Estimated Value: $466,540
Studio
--
Bath
--
Sq Ft
10,280
Sq Ft
About This Home
This home is located at 101 E Algonquin Rd, Algonquin, IL 60102 and is currently estimated at $466,540. 101 E Algonquin Rd is a home located in McHenry County with nearby schools including Eastview Elementary School, Algonquin Middle School, and Dundee-Crown High School.
Ownership History
Date
Name
Owned For
Owner Type
Purchase Details
Closed on
Dec 10, 2019
Sold by
Bartman John R and Bartman Terri L
Bought by
Bartman John R and Bartman Terri L
Current Estimated Value
Purchase Details
Closed on
Dec 14, 2010
Sold by
3-B Entertainment Inc
Bought by
Bartman John B and Bartman Terri L
Home Financials for this Owner
Home Financials are based on the most recent Mortgage that was taken out on this home.
Original Mortgage
$169,062
Interest Rate
4.22%
Mortgage Type
Commercial
Purchase Details
Closed on
Apr 30, 1998
Sold by
Harbor Inn Inc
Bought by
3-B Entertainment Inc
Home Financials for this Owner
Home Financials are based on the most recent Mortgage that was taken out on this home.
Original Mortgage
$175,000
Interest Rate
7.19%
Mortgage Type
Commercial
Create a Home Valuation Report for This Property
The Home Valuation Report is an in-depth analysis detailing your home's value as well as a comparison with similar homes in the area
Purchase History
| Date | Buyer | Sale Price | Title Company |
|---|---|---|---|
| Bartman John R | -- | Attorney | |
| Bartman John B | $227,500 | Fidelity National Title | |
| 3-B Entertainment Inc | $325,000 | -- |
Source: Public Records
Mortgage History
| Date | Status | Borrower | Loan Amount |
|---|---|---|---|
| Closed | Bartman John B | $169,062 | |
| Previous Owner | 3-B Entertainment Inc | $175,000 |
Source: Public Records
Tax History
| Year | Tax Paid | Tax Assessment Tax Assessment Total Assessment is a certain percentage of the fair market value that is determined by local assessors to be the total taxable value of land and additions on the property. | Land | Improvement |
|---|---|---|---|---|
| 2024 | $10,527 | $134,568 | $25,894 | $108,674 |
| 2023 | $10,075 | $120,354 | $99,811 | $20,543 |
| 2022 | $9,315 | $108,623 | $90,082 | $18,541 |
| 2021 | $8,979 | $101,195 | $83,922 | $17,273 |
| 2020 | $8,765 | $97,613 | $80,951 | $16,662 |
| 2019 | $8,579 | $93,428 | $77,480 | $15,948 |
| 2018 | $8,227 | $86,308 | $71,575 | $14,733 |
| 2017 | $8,097 | $81,307 | $67,428 | $13,879 |
| 2016 | $8,019 | $76,258 | $63,241 | $13,017 |
| 2013 | -- | $71,139 | $58,996 | $12,143 |
Source: Public Records
Map
Nearby Homes
- 0 River Dr N Unit MRD12473279
- 407 La Fox River Dr
- 600 E Algonquin Rd
- 21 Division St
- 719 Webster St
- 953 Old Oak Cir
- 1188 E Algonquin Rd
- 720 Ash St
- 1031 Timberwood Ln
- 1200 Hillside View
- 615 Harper Dr
- 730 Chestnut Ct
- Lot #3-5 Hayes Rd
- 0 Natoma Trail
- Lot 4 b Ryan Pkwy
- 1770 E Algonquin Rd
- lot 25 Wabican Trail
- 1625 Powder Horn Dr
- 1439 Lowe Dr
- 1302 Cary Rd
- 100 Jackson St
- 108 Jackson St
- 0000 N River Rd
- 0 N River Rd Unit 8809175
- 2 N River Rd
- 1 N River Rd
- 0 River Dr N Unit 9784221
- 0 River Dr N Unit 9177496
- 0 River Dr N Unit MRD11391787
- 0 River Dr N Unit 10697694
- 216 N River Rd
- 20 S Hubbard St
- 2 S River Rd
- 16 N River Rd
- 23 N River Rd
- 24 N River Rd
- 25 N River Rd
- 1 W Algonquin Rd
- 103 S River Rd
- 8 N Hubbard St
Your Personal Tour Guide
Ask me questions while you tour the home.