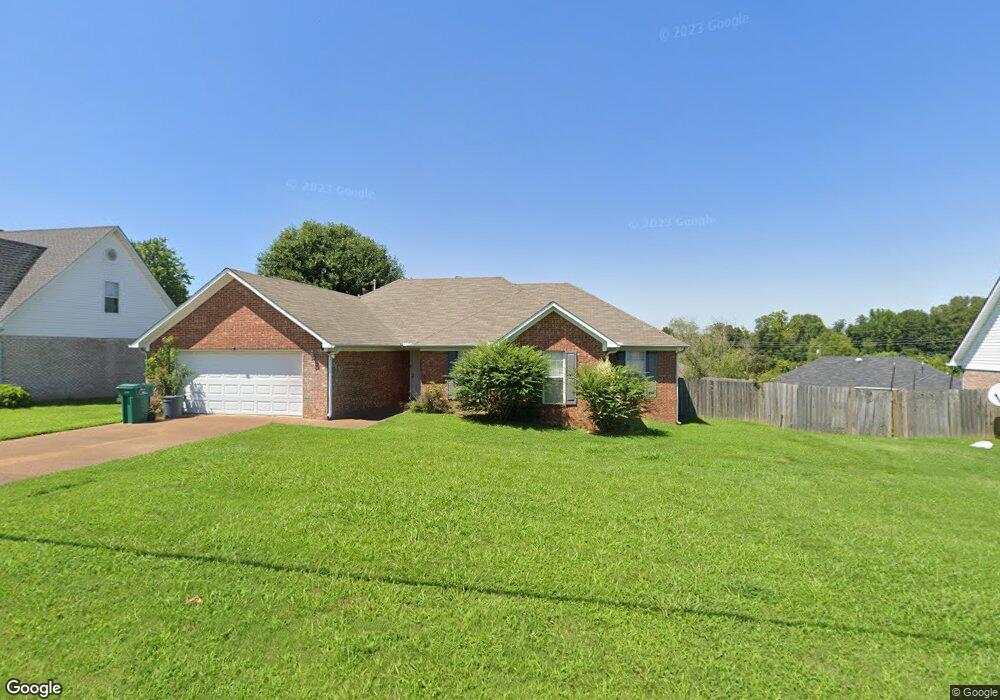
101 Sebastian Dr Jackson, TN 38305
Estimated Value: $246,025 - $281,000
3
Beds
2
Baths
1,856
Sq Ft
$142/Sq Ft
Est. Value
About This Home
This home is located at 101 Sebastian Dr, Jackson, TN 38305 and is currently estimated at $264,256, approximately $142 per square foot. 101 Sebastian Dr is a home located in Madison County with nearby schools including Pope School, Northeast Middle School, and North Side High School.
Ownership History
Date
Name
Owned For
Owner Type
Purchase Details
Closed on
Jun 3, 2010
Sold by
Ashworth Ronnie
Bought by
Tanner Cecelia D
Current Estimated Value
Purchase Details
Closed on
Dec 27, 2002
Sold by
Premier Homes & Const Inc
Bought by
Ronnie Ashworth
Home Financials for this Owner
Home Financials are based on the most recent Mortgage that was taken out on this home.
Original Mortgage
$104,500
Interest Rate
6.1%
Purchase Details
Closed on
Jun 6, 2002
Bought by
Winberry Constr Co
Create a Home Valuation Report for This Property
The Home Valuation Report is an in-depth analysis detailing your home's value as well as a comparison with similar homes in the area
Home Values in the Area
Average Home Value in this Area
Purchase History
| Date | Buyer | Sale Price | Title Company |
|---|---|---|---|
| Tanner Cecelia D | $119,700 | -- | |
| Ronnie Ashworth | $119,900 | -- | |
| Winberry Constr Co | $38,000 | -- |
Source: Public Records
Mortgage History
| Date | Status | Borrower | Loan Amount |
|---|---|---|---|
| Previous Owner | Winberry Constr Co | $104,500 |
Source: Public Records
Tax History Compared to Growth
Tax History
| Year | Tax Paid | Tax Assessment Tax Assessment Total Assessment is a certain percentage of the fair market value that is determined by local assessors to be the total taxable value of land and additions on the property. | Land | Improvement |
|---|---|---|---|---|
| 2024 | $981 | $52,350 | $7,500 | $44,850 |
| 2022 | $1,825 | $52,350 | $7,500 | $44,850 |
| 2021 | $1,463 | $33,925 | $5,125 | $28,800 |
| 2020 | $1,463 | $33,925 | $5,125 | $28,800 |
| 2019 | $1,463 | $33,925 | $5,125 | $28,800 |
| 2018 | $1,463 | $33,925 | $5,125 | $28,800 |
| 2017 | $1,302 | $29,500 | $5,125 | $24,375 |
| 2016 | $1,213 | $29,500 | $5,125 | $24,375 |
| 2015 | $1,213 | $29,500 | $5,125 | $24,375 |
| 2014 | $1,213 | $29,500 | $5,125 | $24,375 |
Source: Public Records
Map
Nearby Homes