Estimated Value: $517,000 - $597,000
3
Beds
2
Baths
1,470
Sq Ft
$376/Sq Ft
Est. Value
About This Home
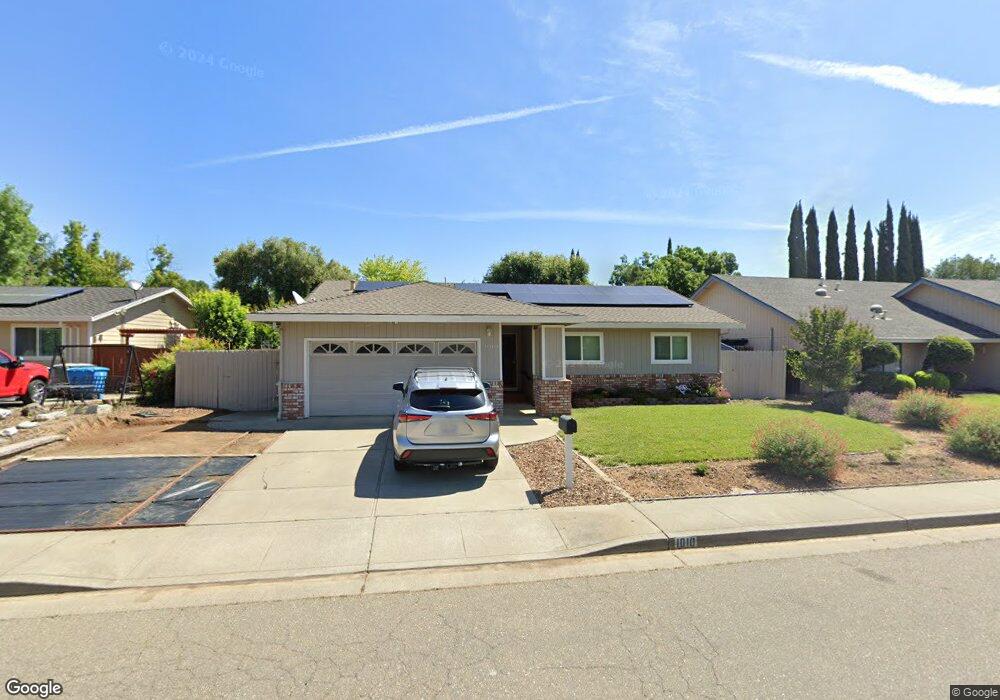
This home is located at 1010 Mason Ct, Dixon, CA 95620 and is currently estimated at $553,446, approximately $376 per square foot. 1010 Mason Ct is a home located in Solano County with nearby schools including Gretchen Higgins Elementary School, Dixon High School, and Dixon Montessori Charter.
Ownership History
Date
Name
Owned For
Owner Type
Purchase Details
Closed on
May 31, 2019
Sold by
Miller David L and Miller Nicole B
Bought by
Miller David L and Miller Nicole B
Current Estimated Value
Home Financials for this Owner
Home Financials are based on the most recent Mortgage that was taken out on this home.
Original Mortgage
$324,600
Outstanding Balance
$285,976
Interest Rate
4.2%
Mortgage Type
New Conventional
Estimated Equity
$267,470
Purchase Details
Closed on
Jun 24, 2015
Sold by
Green Joshua H and Green Samantha D
Bought by
Miller David L and Miller Nicole B
Home Financials for this Owner
Home Financials are based on the most recent Mortgage that was taken out on this home.
Original Mortgage
$337,250
Interest Rate
3.81%
Mortgage Type
New Conventional
Purchase Details
Closed on
Nov 29, 2012
Sold by
Morin Lionel
Bought by
Green Joshua H and Green Samantha D
Home Financials for this Owner
Home Financials are based on the most recent Mortgage that was taken out on this home.
Original Mortgage
$128,000
Interest Rate
3.36%
Mortgage Type
New Conventional
Purchase Details
Closed on
Oct 8, 2004
Sold by
Morin Lionel and Morin Louise
Bought by
Morin Lionel and Morin Louise
Create a Home Valuation Report for This Property
The Home Valuation Report is an in-depth analysis detailing your home's value as well as a comparison with similar homes in the area
Home Values in the Area
Average Home Value in this Area
Purchase History
| Date | Buyer | Sale Price | Title Company |
|---|---|---|---|
| Miller David L | -- | Old Republic Epn | |
| Miller David L | $355,000 | Old Republic Title Company | |
| Green Joshua H | $160,000 | Placer Title Company | |
| Morin Lionel | -- | -- |
Source: Public Records
Mortgage History
| Date | Status | Borrower | Loan Amount |
|---|---|---|---|
| Open | Miller David L | $324,600 | |
| Closed | Miller David L | $337,250 | |
| Previous Owner | Green Joshua H | $128,000 |
Source: Public Records
Tax History
| Year | Tax Paid | Tax Assessment Tax Assessment Total Assessment is a certain percentage of the fair market value that is determined by local assessors to be the total taxable value of land and additions on the property. | Land | Improvement |
|---|---|---|---|---|
| 2025 | $4,819 | $426,647 | $108,161 | $318,486 |
| 2024 | $4,819 | $418,283 | $106,041 | $312,242 |
| 2023 | $4,676 | $410,082 | $103,962 | $306,120 |
| 2022 | $4,606 | $402,042 | $101,924 | $300,118 |
| 2021 | $4,547 | $394,160 | $99,926 | $294,234 |
| 2020 | $4,474 | $390,119 | $98,902 | $291,217 |
| 2019 | $4,389 | $382,470 | $96,963 | $285,507 |
| 2018 | $4,369 | $374,971 | $95,062 | $279,909 |
| 2017 | $4,259 | $367,620 | $93,199 | $274,421 |
| 2016 | $4,075 | $360,413 | $91,372 | $269,041 |
| 2015 | $1,890 | $163,936 | $51,230 | $112,706 |
| 2014 | $1,869 | $160,726 | $50,227 | $110,499 |
Source: Public Records
Map
Nearby Homes
- 840 Green Dr
- 1355 W F St
- 1530 Ferrero Dr
- 795 Michele Ct
- 550 N Lincoln St
- 950 Woodvale Dr
- 1695 Marenda Dr
- 1365 Jacobs Place
- 660 Berkshire Dr
- 695 Fountain Way
- 610 Sierra Dr
- 690 Woodard Way
- 741 W D St S
- 627 Shasta Ct
- 800 N Washington St
- 265 Ahern Ln
- 650 W C St
- 1155 Mulberry Ln
- 689 W C St
- 1250 Redwood Ct
Your Personal Tour Guide
Ask me questions while you tour the home.