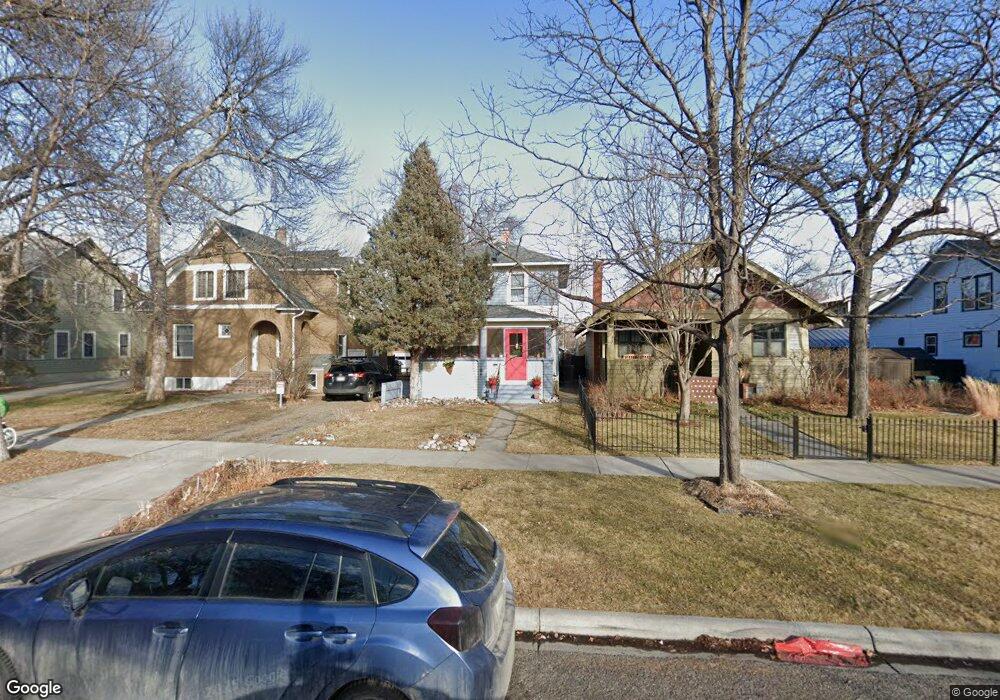
1011 N 31st St Billings, MT 59101
Hilands NeighborhoodEstimated Value: $265,000 - $390,000
2
Beds
1
Bath
1,320
Sq Ft
$235/Sq Ft
Est. Value
About This Home
This home is located at 1011 N 31st St, Billings, MT 59101 and is currently estimated at $310,642, approximately $235 per square foot. 1011 N 31st St is a home located in Yellowstone County with nearby schools including McKinley School, Lewis & Clark Junior High School, and Billings Senior High School.
Ownership History
Date
Name
Owned For
Owner Type
Purchase Details
Closed on
Dec 6, 2011
Sold by
Brakke Family Trust and Michael Hopper Stacy
Bought by
Boomer Oil & Gas Inc
Current Estimated Value
Purchase Details
Closed on
Jun 30, 2008
Sold by
Hopper William L
Bought by
Michael Stacy L
Purchase Details
Closed on
Feb 21, 2003
Sold by
Marble Roberta
Bought by
Hopper Stacy Michael and Hopper William L
Purchase Details
Closed on
Aug 20, 2002
Sold by
Brakke Clara I and Henderson Judith
Bought by
Marble Roberta and Hopper Stacy Michael
Create a Home Valuation Report for This Property
The Home Valuation Report is an in-depth analysis detailing your home's value as well as a comparison with similar homes in the area
Home Values in the Area
Average Home Value in this Area
Purchase History
| Date | Buyer | Sale Price | Title Company |
|---|---|---|---|
| Boomer Oil & Gas Inc | -- | None Available | |
| Michael Stacy L | -- | None Available | |
| Hopper Stacy Michael | -- | None Available | |
| Marble Roberta | -- | None Available |
Source: Public Records
Tax History Compared to Growth
Tax History
| Year | Tax Paid | Tax Assessment Tax Assessment Total Assessment is a certain percentage of the fair market value that is determined by local assessors to be the total taxable value of land and additions on the property. | Land | Improvement |
|---|---|---|---|---|
| 2025 | $2,273 | $270,100 | $45,307 | $224,793 |
| 2024 | $2,273 | $237,500 | $41,182 | $196,318 |
| 2023 | $2,259 | $237,500 | $41,182 | $196,318 |
| 2022 | $1,709 | $181,100 | $0 | $0 |
| 2021 | $1,874 | $181,100 | $0 | $0 |
| 2020 | $1,888 | $174,200 | $0 | $0 |
| 2019 | $1,798 | $174,200 | $0 | $0 |
| 2018 | $1,687 | $160,000 | $0 | $0 |
| 2017 | $1,481 | $160,000 | $0 | $0 |
| 2016 | $1,614 | $159,000 | $0 | $0 |
| 2015 | $1,574 | $159,000 | $0 | $0 |
| 2014 | $1,383 | $73,882 | $0 | $0 |
Source: Public Records
Map
Nearby Homes
- 125 Avenue B
- 135 Grand Ave
- 2207 Pine St
- 2415 Ash St
- 225 Burlington Ave
- 509 Avenue E
- 511 Avenue F
- 607 26th St W
- 1114 N 24th St
- 1121 N 24th St
- 1143 N 24th St
- 402 Burlington Ave
- 715 N 24th St
- 1114 4th St W
- 235 N 32nd #105 St Unit 105
- 235 N 32nd St
- 1130 N 23rd St
- 945 N 23rd St
- TBD Tumbleweed Dr
- 300 N 25th St Unit 401