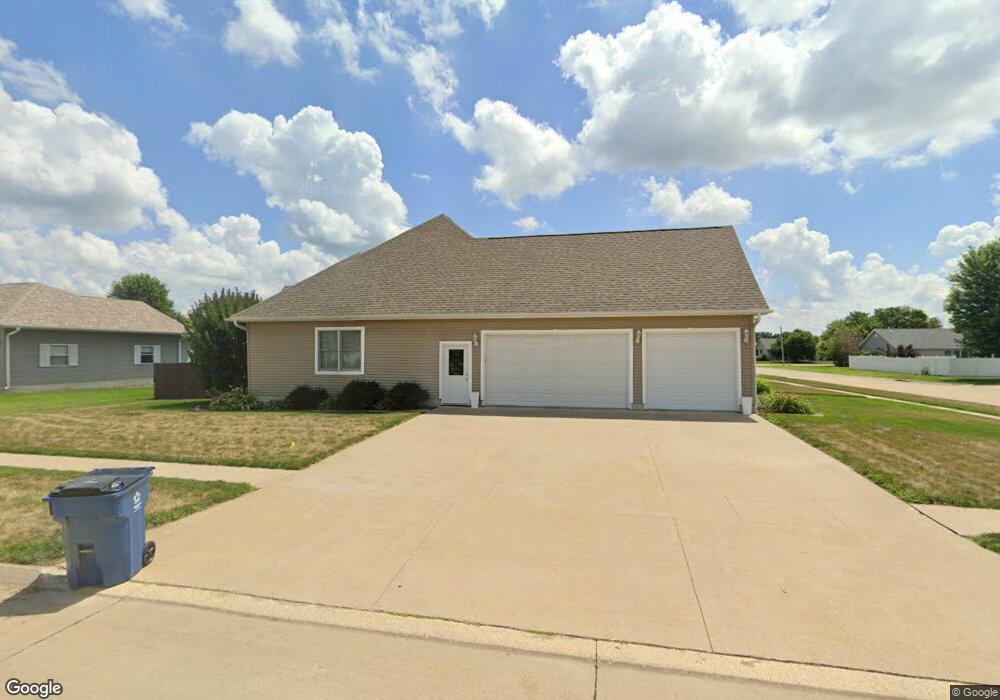
1012 21st Ave Camanche, IA 52730
Estimated Value: $327,000 - $425,000
3
Beds
3
Baths
2,004
Sq Ft
$188/Sq Ft
Est. Value
About This Home
This home is located at 1012 21st Ave, Camanche, IA 52730 and is currently estimated at $376,812, approximately $188 per square foot. 1012 21st Ave is a home located in Clinton County with nearby schools including Camanche Elementary School, Camanche Middle School, and Camanche High School.
Ownership History
Date
Name
Owned For
Owner Type
Purchase Details
Closed on
Oct 16, 2009
Sold by
River City Construction & Storage Inc
Bought by
Liddle Jamie A and Liddle Melissa J
Current Estimated Value
Home Financials for this Owner
Home Financials are based on the most recent Mortgage that was taken out on this home.
Original Mortgage
$197,600
Outstanding Balance
$129,490
Interest Rate
5.15%
Mortgage Type
New Conventional
Estimated Equity
$247,322
Purchase Details
Closed on
Nov 11, 2005
Sold by
Murphy Alan D and Murphy Bonnie R
Bought by
Co River City Construction & Storage I
Create a Home Valuation Report for This Property
The Home Valuation Report is an in-depth analysis detailing your home's value as well as a comparison with similar homes in the area
Home Values in the Area
Average Home Value in this Area
Purchase History
| Date | Buyer | Sale Price | Title Company |
|---|---|---|---|
| Liddle Jamie A | $248,000 | None Available | |
| Co River City Construction & Storage I | $25,500 | None Available |
Source: Public Records
Mortgage History
| Date | Status | Borrower | Loan Amount |
|---|---|---|---|
| Open | Liddle Jamie A | $197,600 |
Source: Public Records
Tax History Compared to Growth
Tax History
| Year | Tax Paid | Tax Assessment Tax Assessment Total Assessment is a certain percentage of the fair market value that is determined by local assessors to be the total taxable value of land and additions on the property. | Land | Improvement |
|---|---|---|---|---|
| 2025 | $6,308 | $373,570 | $36,590 | $336,980 |
| 2024 | $6,308 | $344,920 | $36,590 | $308,330 |
| 2023 | $6,082 | $344,920 | $36,590 | $308,330 |
| 2022 | $5,538 | $306,670 | $36,590 | $270,080 |
| 2021 | $5,354 | $277,200 | $41,260 | $235,940 |
| 2020 | $5,354 | $264,780 | $41,260 | $223,520 |
| 2019 | $4,700 | $252,360 | $0 | $0 |
| 2018 | $4,878 | $252,360 | $0 | $0 |
| 2017 | $4,878 | $252,360 | $0 | $0 |
| 2016 | $4,426 | $233,310 | $0 | $0 |
| 2015 | $4,426 | $233,310 | $0 | $0 |
| 2014 | $4,484 | $233,310 | $0 | $0 |
| 2013 | -- | $0 | $0 | $0 |
Source: Public Records
Map
Nearby Homes