
Seller's Agent in 2018
Michael Penrod
My Home Group Real Estate
(602) 370-8851
2 Total Sales
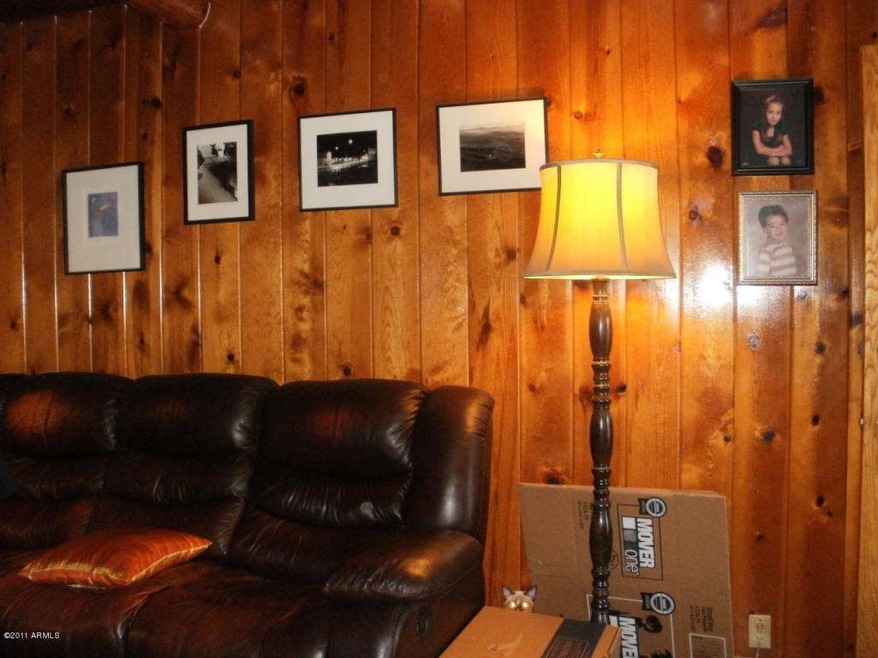
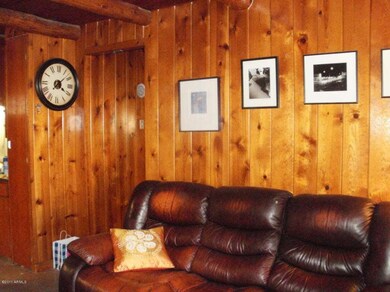
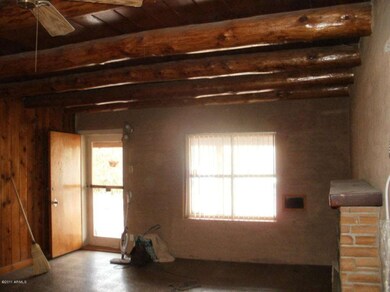
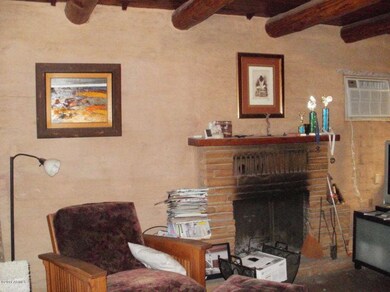
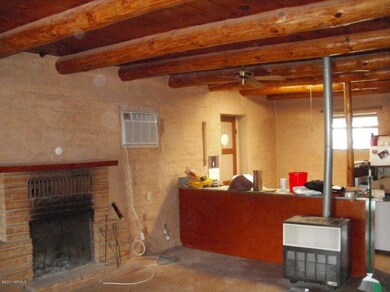
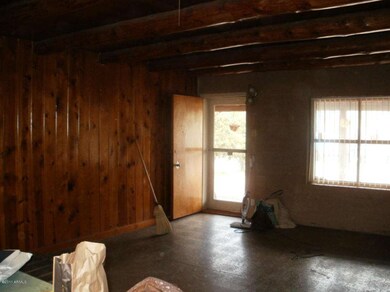
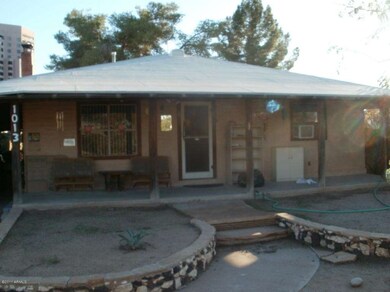
''GREAT LOCATION W/FULL BASEMENT''in Phoenix Urban Historic District Downtown Central Phoenix Historic Area Indian School & 12th St! Original 3 Bedroom Adobe Home With Cabin Wood Rustic Interior & Log Wood Beams &''Full Basement adds 960Sf''Including Work Shop,& Lots of Storage Perfect Wine Cellar 2 Cozy Fireplaces & Central Heat! Covered Wooden Front Porch 2 car Covered Tandem Carport Separate Entrance to Master Suite With Full Bath Walk-In Closets Desk & Tech Ctr Breakfast Bar in Kitchen Dining Area Large Treed Yard Close to Downtown Suns Sports Complex Arena Phoenix Children's & St Johns Hospitals University of Phoenix Walk to Long View Elementary North of Phoenix Golf Country Club Close to 51 I10 I17 Freeways Public Transportation & Light Rail(INS HAS AGREED TO DO BACK PORTION OF ROOF)
Last Agent to Sell the Property
Buyers Information Service, Inc. Brokerage Phone: 602-647-4888 License #BR028502000 Listed on: 10/09/2015
Last Buyer's Agent
Danielle LaFata
American Realty Brokers License #SA660765000
| Date | Type | Sale Price | Title Company |
|---|---|---|---|
| Interfamily Deed Transfer | -- | Empire Title Agency | |
| Interfamily Deed Transfer | -- | None Available | |
| Warranty Deed | $465,000 | Fidelity National Title Agen | |
| Warranty Deed | -- | None Available | |
| Warranty Deed | $156,000 | First American Title Ins Co | |
| Warranty Deed | $140,000 | Security Title Agency | |
| Interfamily Deed Transfer | -- | -- |
| Date | Status | Loan Amount | Loan Type |
|---|---|---|---|
| Open | $271,500 | New Conventional | |
| Closed | $312,000 | New Conventional | |
| Closed | $359,000 | New Conventional | |
| Previous Owner | -- | No Value Available | |
| Previous Owner | $40,000 | Unknown | |
| Previous Owner | $225,000 | Purchase Money Mortgage | |
| Previous Owner | $150,876 | VA | |
| Previous Owner | $143,010 | VA |
| Date | Event | Price | Change | Sq Ft Price |
|---|---|---|---|---|
| 02/21/2018 02/21/18 | Sold | $465,000 | -2.7% | $221 / Sq Ft |
| 01/29/2018 01/29/18 | Pending | -- | -- | -- |
| 01/19/2018 01/19/18 | Price Changed | $477,900 | -0.4% | $227 / Sq Ft |
| 12/21/2017 12/21/17 | Price Changed | $479,900 | -0.7% | $228 / Sq Ft |
| 11/30/2017 11/30/17 | Price Changed | $483,500 | -0.2% | $230 / Sq Ft |
| 11/09/2017 11/09/17 | Price Changed | $484,500 | -1.0% | $230 / Sq Ft |
| 11/02/2017 11/02/17 | Price Changed | $489,500 | -0.9% | $233 / Sq Ft |
| 10/25/2017 10/25/17 | Price Changed | $493,975 | -1.0% | $235 / Sq Ft |
| 10/21/2017 10/21/17 | Price Changed | $498,975 | -0.2% | $237 / Sq Ft |
| 10/09/2017 10/09/17 | For Sale | $499,999 | +220.5% | $238 / Sq Ft |
| 03/15/2016 03/15/16 | Sold | $156,000 | +0.6% | $131 / Sq Ft |
| 01/24/2016 01/24/16 | Pending | -- | -- | -- |
| 01/14/2016 01/14/16 | Price Changed | $155,000 | +3.3% | $130 / Sq Ft |
| 01/12/2016 01/12/16 | Price Changed | $150,000 | -3.8% | $126 / Sq Ft |
| 01/01/2016 01/01/16 | Price Changed | $155,900 | -0.4% | $131 / Sq Ft |
| 12/07/2015 12/07/15 | Price Changed | $156,500 | -1.4% | $131 / Sq Ft |
| 12/04/2015 12/04/15 | Price Changed | $158,800 | +0.6% | $133 / Sq Ft |
| 11/19/2015 11/19/15 | Price Changed | $157,800 | -0.1% | $132 / Sq Ft |
| 11/10/2015 11/10/15 | Price Changed | $157,888 | -0.6% | $132 / Sq Ft |
| 10/30/2015 10/30/15 | Price Changed | $158,900 | -0.6% | $133 / Sq Ft |
| 10/29/2015 10/29/15 | Price Changed | $159,900 | -0.1% | $134 / Sq Ft |
| 10/28/2015 10/28/15 | Price Changed | $159,988 | 0.0% | $134 / Sq Ft |
| 10/26/2015 10/26/15 | Price Changed | $159,998 | 0.0% | $134 / Sq Ft |
| 10/20/2015 10/20/15 | Price Changed | $159,999 | -3.0% | $134 / Sq Ft |
| 10/15/2015 10/15/15 | Price Changed | $164,988 | 0.0% | $138 / Sq Ft |
| 10/09/2015 10/09/15 | For Sale | $164,999 | 0.0% | $138 / Sq Ft |
| 02/27/2013 02/27/13 | Rented | $858 | -4.6% | -- |
| 02/25/2013 02/25/13 | Under Contract | -- | -- | -- |
| 01/03/2013 01/03/13 | For Rent | $899 | 0.0% | -- |
| 01/14/2012 01/14/12 | Rented | $899 | -18.3% | -- |
| 01/12/2012 01/12/12 | Under Contract | -- | -- | -- |
| 12/06/2011 12/06/11 | For Rent | $1,100 | -- | -- |
| Year | Tax Paid | Tax Assessment Tax Assessment Total Assessment is a certain percentage of the fair market value that is determined by local assessors to be the total taxable value of land and additions on the property. | Land | Improvement |
|---|---|---|---|---|
| 2025 | $3,010 | $27,287 | -- | -- |
| 2024 | $2,898 | $25,987 | -- | -- |
| 2023 | $2,898 | $53,670 | $10,730 | $42,940 |
| 2022 | $2,886 | $39,820 | $7,960 | $31,860 |
| 2021 | $2,971 | $34,280 | $6,850 | $27,430 |
| 2020 | $2,890 | $32,000 | $6,400 | $25,600 |
| 2019 | $2,755 | $28,280 | $5,650 | $22,630 |
| 2018 | $685 | $13,450 | $2,690 | $10,760 |
| 2017 | $714 | $10,280 | $2,050 | $8,230 |
| 2016 | $689 | $8,500 | $1,700 | $6,800 |
| 2015 | $559 | $6,880 | $1,370 | $5,510 |
Seller's Agent in 2018
Michael Penrod
My Home Group Real Estate
(602) 370-8851
2 Total Sales
Buyer's Agent in 2018
Beau MacDonnell
eXp Realty
(480) 492-9200
24 Total Sales
Seller's Agent in 2016
Kim Bongiorno
Buyers Information Service, Inc.
(602) 647-4888
49 Total Sales
D
Buyer's Agent in 2016
Danielle LaFata
American Realty Brokers
Source: Arizona Regional Multiple Listing Service (ARMLS)
MLS Number: 5346306
APN: 118-06-099
Disclaimer: Certain information contained herein is derived from information provided by parties other than Homes.com. All information provided is deemed reliable, but is not guaranteed to be accurate and should be independently verified.
![]() All information should be verified by the recipient and none is guaranteed as accurate by ARMLS
All information should be verified by the recipient and none is guaranteed as accurate by ARMLS
Listing Information presented by local MLS brokerage: Ten-X, local REALTOR®- Arlene Richardson - (888)-952-6393