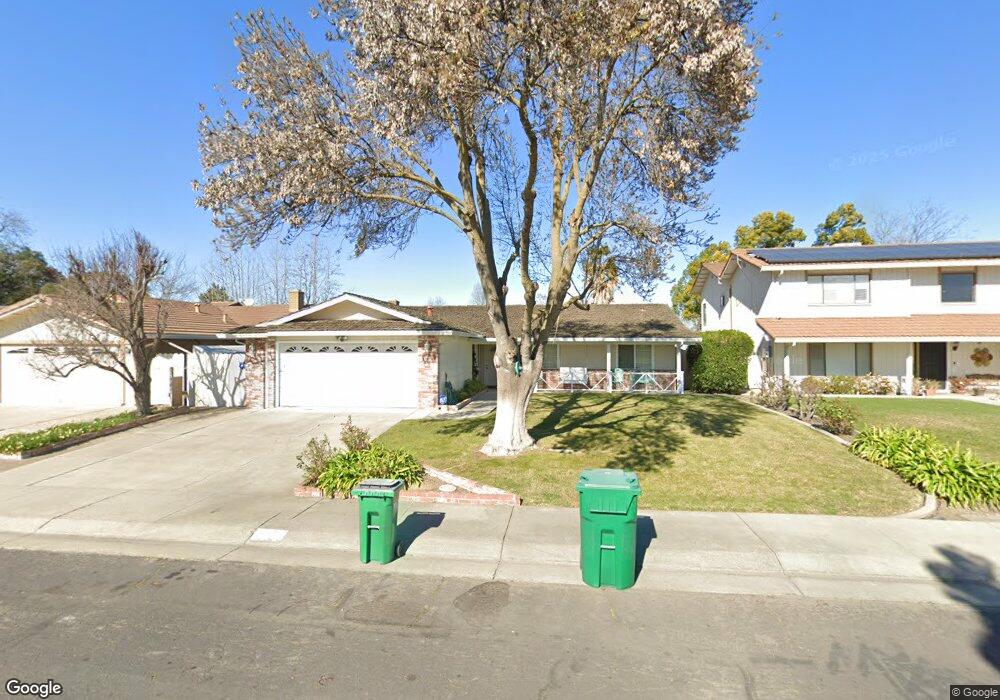
1013 Goldenoak Way Stockton, CA 95209
Stonewood NeighborhoodEstimated Value: $405,456 - $443,000
3
Beds
2
Baths
1,515
Sq Ft
$285/Sq Ft
Est. Value
About This Home
This home is located at 1013 Goldenoak Way, Stockton, CA 95209 and is currently estimated at $431,614, approximately $284 per square foot. 1013 Goldenoak Way is a home located in San Joaquin County with nearby schools including Oakwood Elementary School, Delta Sierra Middle School, and Bear Creek High School.
Ownership History
Date
Name
Owned For
Owner Type
Purchase Details
Closed on
Oct 13, 2020
Sold by
Samski Rod J and Rod J Samski 2003 Trust
Bought by
Samski Rod J and Rod J Samski 2003 Trust
Current Estimated Value
Purchase Details
Closed on
Jul 19, 2010
Sold by
Samski Rod J
Bought by
Samski Rod J
Home Financials for this Owner
Home Financials are based on the most recent Mortgage that was taken out on this home.
Original Mortgage
$247,500
Interest Rate
4.71%
Mortgage Type
Reverse Mortgage Home Equity Conversion Mortgage
Purchase Details
Closed on
Oct 22, 2003
Sold by
Samski Rod J and Rod J Samski 2003 Trust
Bought by
Samski Rod J
Create a Home Valuation Report for This Property
The Home Valuation Report is an in-depth analysis detailing your home's value as well as a comparison with similar homes in the area
Home Values in the Area
Average Home Value in this Area
Purchase History
| Date | Buyer | Sale Price | Title Company |
|---|---|---|---|
| Samski Rod J | -- | Fnc Title Of Ca | |
| Samski Rod J | -- | Fidelity Natl Title Co Of Ca | |
| Samski Rod J | -- | -- |
Source: Public Records
Mortgage History
| Date | Status | Borrower | Loan Amount |
|---|---|---|---|
| Closed | Samski Rod J | $247,500 |
Source: Public Records
Tax History Compared to Growth
Tax History
| Year | Tax Paid | Tax Assessment Tax Assessment Total Assessment is a certain percentage of the fair market value that is determined by local assessors to be the total taxable value of land and additions on the property. | Land | Improvement |
|---|---|---|---|---|
| 2025 | $2,466 | $225,309 | $77,991 | $147,318 |
| 2024 | $2,419 | $220,892 | $76,462 | $144,430 |
| 2023 | $2,390 | $216,562 | $74,963 | $141,599 |
| 2022 | $2,333 | $212,317 | $73,494 | $138,823 |
| 2021 | $2,385 | $208,154 | $72,053 | $136,101 |
| 2020 | $2,327 | $206,021 | $71,315 | $134,706 |
| 2019 | $2,272 | $201,982 | $69,917 | $132,065 |
| 2018 | $2,230 | $198,023 | $68,547 | $129,476 |
| 2017 | $2,176 | $194,141 | $67,203 | $126,938 |
| 2016 | $2,049 | $190,334 | $65,885 | $124,449 |
| 2014 | $1,731 | $158,000 | $47,000 | $111,000 |
Source: Public Records
Map
Nearby Homes
- 1020 Oakleaf Way
- 916 Springoak Way
- 8715 Eastwood Ct
- 1418 Woodcreek Way
- 1235 Briarwood Way
- 8811 Davis Rd
- 8518 Burns Place
- 1017 Royal Oaks Dr
- 948 Macduff Ave
- 8419 Macduff Ct
- 8603 Acapulco Way
- 764 Macduff Ave
- 1626 Navajo Dr
- 9221 N El Dorado St
- 9511 Theresa Cir
- 1629 Cortez Ave
- 9431 Shawnee Ct
- 8824 N El Dorado St
- 8160 Encino Ave
- 8306 Galloway Dr
- 1027 Goldenoak Way
- 1011 Goldenoak Way
- 1032 Springoak Way
- 1038 Springoak Way
- 1035 Goldenoak Way
- 1003 Goldenoak Way
- 1026 Springoak Way
- 1044 Springoak Way Unit 5
- 1018 Goldenoak Way
- 1026 Goldenoak Way
- 1020 Springoak Way
- 1010 Goldenoak Way
- 1051 Goldenoak Way
- 1034 Goldenoak Way
- 995 Goldenoak Way
- 1050 Springoak Way
- 1002 Goldenoak Way
- 1014 Springoak Way
- 1119 Goldenoak Way
- 1033 Springoak Way