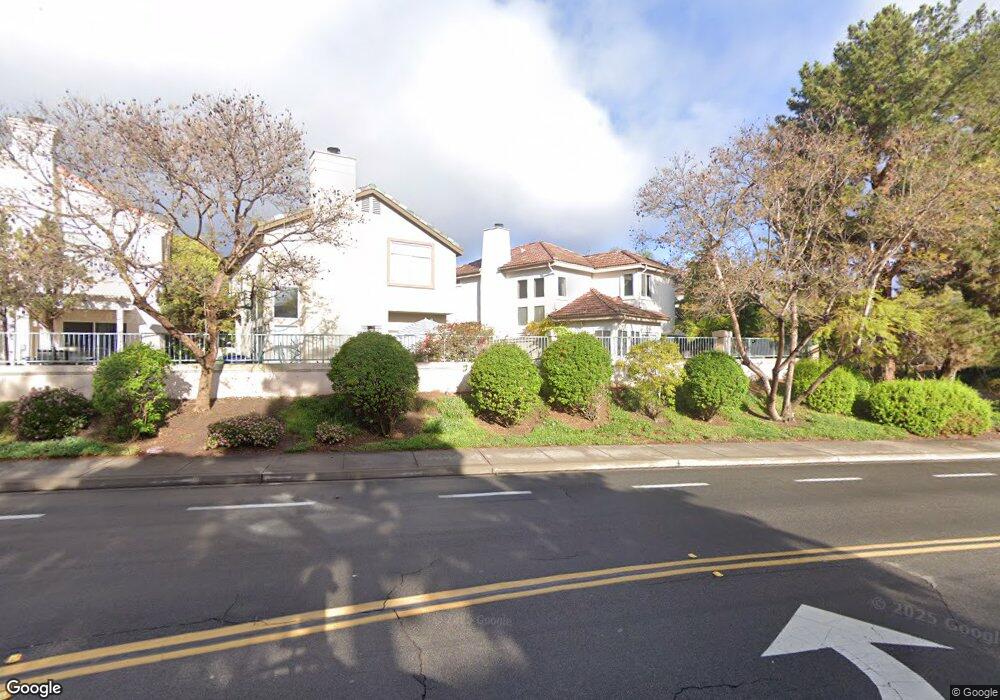
1013 Laguna Seca Loop Unit 4 Chula Vista, CA 91915
Eastlake NeighborhoodEstimated Value: $673,078 - $756,000
3
Beds
3
Baths
1,341
Sq Ft
$543/Sq Ft
Est. Value
About This Home
This home is located at 1013 Laguna Seca Loop Unit 4, Chula Vista, CA 91915 and is currently estimated at $728,520, approximately $543 per square foot. 1013 Laguna Seca Loop Unit 4 is a home located in San Diego County with nearby schools including Olympic View Elementary School, Eastlake Middle School, and Eastlake High School.
Ownership History
Date
Name
Owned For
Owner Type
Purchase Details
Closed on
Mar 22, 2024
Sold by
Shin Jung Ja and Kouchi Dennis D
Bought by
Shin Jung Ja and Kouchi Dennis D
Current Estimated Value
Purchase Details
Closed on
Mar 23, 2009
Sold by
Kouchi Dennis D and Shin Jung Ja
Bought by
Shin Jung Ja and Kouchi Dennis D
Home Financials for this Owner
Home Financials are based on the most recent Mortgage that was taken out on this home.
Original Mortgage
$192,000
Interest Rate
5.15%
Mortgage Type
Stand Alone Refi Refinance Of Original Loan
Purchase Details
Closed on
Jan 18, 1996
Sold by
Parcel R-24/R-25 Ltd Partnership
Bought by
Kouchi Dennis D and Shin Jung Ja
Home Financials for this Owner
Home Financials are based on the most recent Mortgage that was taken out on this home.
Original Mortgage
$141,900
Interest Rate
6.99%
Mortgage Type
FHA
Create a Home Valuation Report for This Property
The Home Valuation Report is an in-depth analysis detailing your home's value as well as a comparison with similar homes in the area
Home Values in the Area
Average Home Value in this Area
Purchase History
| Date | Buyer | Sale Price | Title Company |
|---|---|---|---|
| Shin Jung Ja | -- | None Listed On Document | |
| Shin Jung Ja | -- | Lawyers Title | |
| Kouchi Dennis D | $159,000 | First American Title |
Source: Public Records
Mortgage History
| Date | Status | Borrower | Loan Amount |
|---|---|---|---|
| Previous Owner | Shin Jung Ja | $192,000 | |
| Previous Owner | Kouchi Dennis D | $141,900 |
Source: Public Records
Tax History
| Year | Tax Paid | Tax Assessment Tax Assessment Total Assessment is a certain percentage of the fair market value that is determined by local assessors to be the total taxable value of land and additions on the property. | Land | Improvement |
|---|---|---|---|---|
| 2025 | $2,965 | $263,945 | $117,935 | $146,010 |
| 2024 | $2,965 | $258,771 | $115,623 | $143,148 |
| 2023 | $2,915 | $253,698 | $113,356 | $140,342 |
| 2022 | $2,832 | $248,725 | $111,134 | $137,591 |
| 2021 | $2,765 | $243,849 | $108,955 | $134,894 |
| 2020 | $3,445 | $241,349 | $107,838 | $133,511 |
| 2019 | $3,356 | $236,618 | $105,724 | $130,894 |
| 2018 | $3,295 | $231,979 | $103,651 | $128,328 |
| 2017 | $12 | $227,431 | $101,619 | $125,812 |
| 2016 | $3,141 | $222,973 | $99,627 | $123,346 |
| 2015 | $3,090 | $219,625 | $98,131 | $121,494 |
| 2014 | $3,399 | $215,324 | $96,209 | $119,115 |
Source: Public Records
Map
Nearby Homes
- 1081 Waterville Lake Rd
- 1194 La Vida Ct
- 1216 La Vida Ct Unit 46
- 2505 Whispering Palms Loop
- 2034 Mount Langley St
- 2517 Whispering Palms Loop
- 1035 Park Meadows Rd
- 1129 Quinto Creek Place
- 2122 Bluewater Ln
- 1170 Pinto Canyon Ln
- 2185 Caminito Rinaldo Unit 118
- 2140 Waterside Dr
- 795 Brookstone Rd Unit 102
- 774 Eastshore Terrace Unit 169
- 2077 Lakeridge Cir Unit 104
- 2083 Lakeridge Cir Unit 104
- 2063 Lakeridge Cir Unit 101
- 760 Eastshore Terrace Unit 139
- 1350 Borrego Springs Rd
- 773 Brookstone Rd Unit 304
- 1019 Laguna Seca Loop
- 1017 Laguna Seca Loop
- 1015 Laguna Seca Loop
- 1011 Laguna Seca Loop
- 1020 Laguna Seca Loop Unit 8
- 1021 Laguna Seca Loop Unit 9
- 1023 Laguna Seca Loop
- 1051 Waterville Lake Rd
- 1025 Laguna Seca Loop
- 1070 Laguna Seca Loop
- 1026 Laguna Seca Loop Unit 14
- 1077 Laguna Seca Loop
- 1053 Waterville Lake Rd
- 1068 Laguna Seca Loop
- 1073 Laguna Seca Loop Unit 46
- 1075 Laguna Seca Loop
- 1029 Laguna Seca Loop
- 1028 Laguna Seca Loop
- 1027 Laguna Seca Loop
- 1024 Laguna Seca Loop Unit 12
Your Personal Tour Guide
Ask me questions while you tour the home.