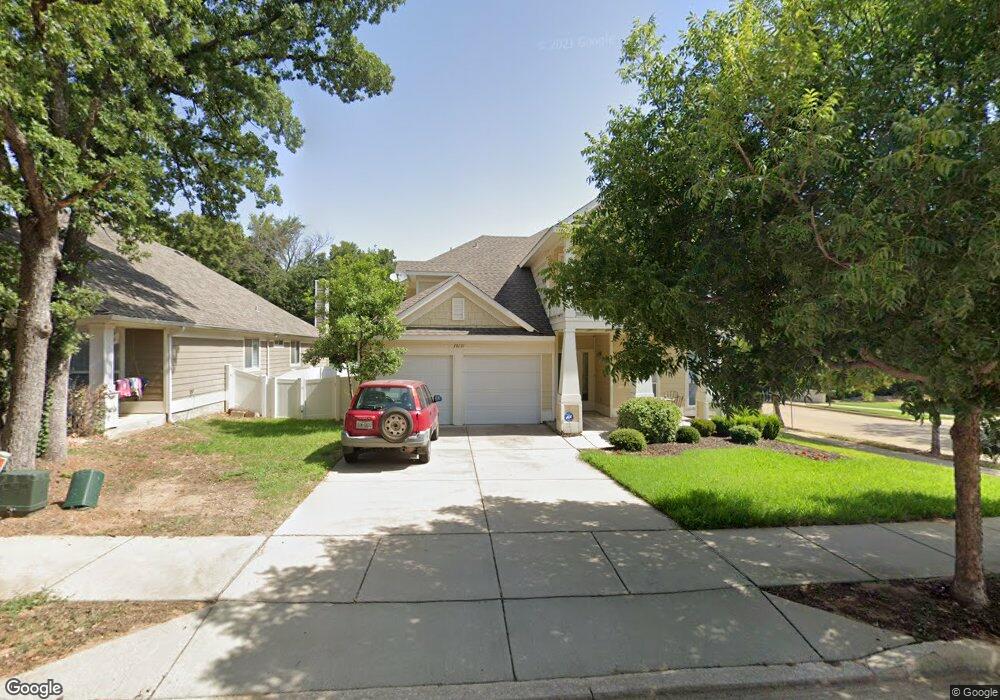
10131 Cherry Hill Ln Providence Village, TX 76227
Estimated Value: $344,891 - $373,000
3
Beds
2
Baths
2,538
Sq Ft
$143/Sq Ft
Est. Value
About This Home
This home is located at 10131 Cherry Hill Ln, Providence Village, TX 76227 and is currently estimated at $361,723, approximately $142 per square foot. 10131 Cherry Hill Ln is a home located in Denton County with nearby schools including Monaco Elementary School, Aubrey Middle School, and Aubrey High School.
Ownership History
Date
Name
Owned For
Owner Type
Purchase Details
Closed on
Aug 8, 2007
Sold by
Wancho Frank William
Bought by
Wancho Roxane Marie
Current Estimated Value
Home Financials for this Owner
Home Financials are based on the most recent Mortgage that was taken out on this home.
Original Mortgage
$185,640
Outstanding Balance
$117,718
Interest Rate
6.69%
Mortgage Type
New Conventional
Estimated Equity
$244,005
Purchase Details
Closed on
Mar 30, 2005
Sold by
Continental Homes Of Texas Lp
Bought by
Wancho Frank William and Wancho Roxane Marie
Home Financials for this Owner
Home Financials are based on the most recent Mortgage that was taken out on this home.
Original Mortgage
$185,640
Interest Rate
5.75%
Mortgage Type
Purchase Money Mortgage
Create a Home Valuation Report for This Property
The Home Valuation Report is an in-depth analysis detailing your home's value as well as a comparison with similar homes in the area
Home Values in the Area
Average Home Value in this Area
Purchase History
| Date | Buyer | Sale Price | Title Company |
|---|---|---|---|
| Wancho Roxane Marie | -- | None Available | |
| Wancho Frank William | -- | -- |
Source: Public Records
Mortgage History
| Date | Status | Borrower | Loan Amount |
|---|---|---|---|
| Open | Wancho Roxane Marie | $185,640 | |
| Closed | Wancho Frank William | $185,640 |
Source: Public Records
Tax History Compared to Growth
Tax History
| Year | Tax Paid | Tax Assessment Tax Assessment Total Assessment is a certain percentage of the fair market value that is determined by local assessors to be the total taxable value of land and additions on the property. | Land | Improvement |
|---|---|---|---|---|
| 2025 | $5,418 | $371,658 | $98,283 | $273,375 |
| 2024 | $6,707 | $348,857 | $0 | $0 |
| 2023 | $4,926 | $317,143 | $98,283 | $282,577 |
| 2022 | $6,523 | $288,312 | $77,955 | $257,788 |
| 2021 | $6,568 | $262,102 | $54,262 | $207,840 |
| 2020 | $6,530 | $252,993 | $54,262 | $198,731 |
| 2019 | $6,962 | $266,205 | $54,262 | $211,943 |
| 2018 | $6,571 | $254,531 | $63,462 | $198,789 |
| 2017 | $6,054 | $231,392 | $63,462 | $168,218 |
| 2016 | $5,596 | $210,356 | $50,475 | $174,520 |
| 2015 | $4,610 | $191,233 | $32,881 | $163,777 |
| 2013 | -- | $158,044 | $32,881 | $125,163 |
Source: Public Records
Map
Nearby Homes
- 1807 Bridgeport Dr
- 1808 Plymouth Dr
- 10025 Cherry Hill Ln
- 10017 Cherry Hill Ln
- 1900 Plymouth Dr
- 9938 Wethers Field Cir
- 10013 Boston Harbor Dr
- 2012 Plymouth Dr
- 2013 Nokota Pkwy
- 9914 Wethers Field Cir
- 9912 Concord Dr
- 9921 Boston Harbor Dr
- 10105 Lexington Dr
- Celina Plan at Providence Commons
- Alpharetta II Plan at Providence Commons
- Orinda Plan at Providence Commons
- 9908 Cedarcrest Dr
- 9870 Cedarcrest Dr
- 1609 Cambridge Dr
- Joplin w/ 3 Car Garage Plan at Foree Ranch - Classic 3 Car Collection
- 10127 Cherry Hill Ln
- 10123 Cherry Hill Ln
- 1624 Bridgeport Dr
- 1620 Bridgeport Dr
- 10117 Cherry Hill Ln
- 10132 Cherry Hill Ln
- 10128 Cherry Hill Ln
- 1616 Bridgeport Dr
- 10124 Cherry Hill Ln
- 10113 Cherry Hill Ln
- 10120 Cherry Hill Ln
- 1612 Bridgeport Dr
- 10116 Cherry Hill Ln
- 10109 Cherry Hill Ln
- 10112 Cherry Hill Ln
- 1608 Bridgeport Dr
- 10108 Cherry Hill Ln
- 10137 Hanover Dr
- 10133 Hanover Dr
- 10105 Cherry Hill Ln