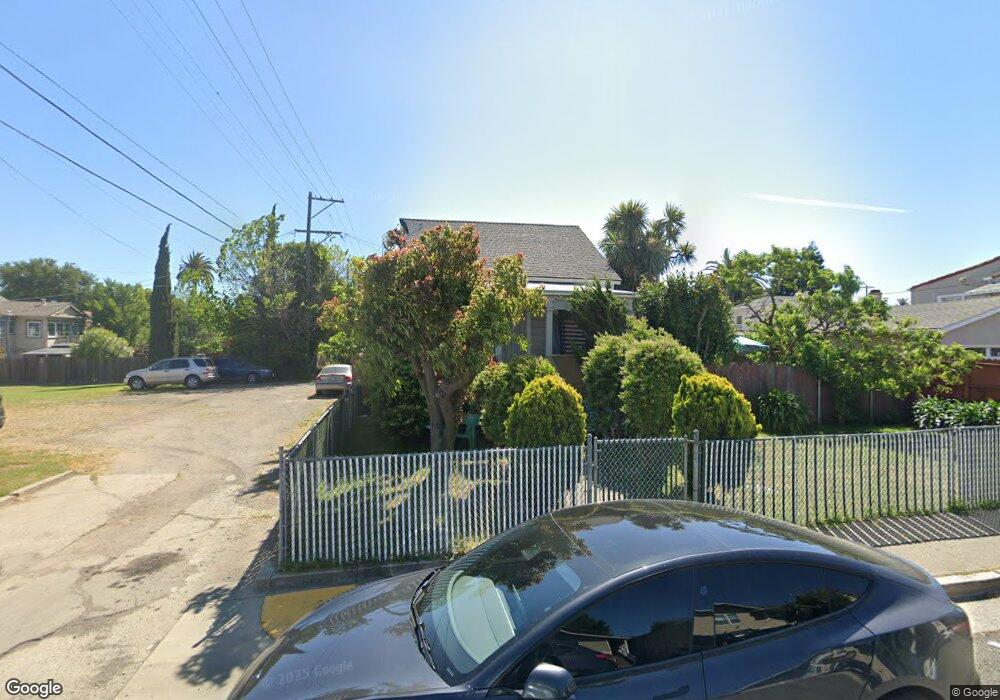
1014 Monterey St Vallejo, CA 94590
West Vallejo NeighborhoodEstimated Value: $293,000 - $414,000
2
Beds
1
Bath
796
Sq Ft
$442/Sq Ft
Est. Value
About This Home
This home is located at 1014 Monterey St, Vallejo, CA 94590 and is currently estimated at $351,447, approximately $441 per square foot. 1014 Monterey St is a home located in Solano County with nearby schools including Highland Elementary, Vallejo High School, and Caliber: ChangeMakers Academy.
Ownership History
Date
Name
Owned For
Owner Type
Purchase Details
Closed on
Dec 11, 2009
Sold by
Rodriguez Armida
Bought by
Hernandez Yvette
Current Estimated Value
Purchase Details
Closed on
Oct 23, 2006
Sold by
Rodriguez Armida
Bought by
Rodriguez Armida
Home Financials for this Owner
Home Financials are based on the most recent Mortgage that was taken out on this home.
Original Mortgage
$150,000
Interest Rate
6.39%
Mortgage Type
New Conventional
Purchase Details
Closed on
Sep 16, 2000
Sold by
Rodriguez Ramos Armida
Bought by
Rodriguez Armida
Create a Home Valuation Report for This Property
The Home Valuation Report is an in-depth analysis detailing your home's value as well as a comparison with similar homes in the area
Home Values in the Area
Average Home Value in this Area
Purchase History
| Date | Buyer | Sale Price | Title Company |
|---|---|---|---|
| Hernandez Yvette | -- | None Available | |
| Rodriguez Armida | -- | North American Title Co | |
| Rodriguez Armida | -- | -- |
Source: Public Records
Mortgage History
| Date | Status | Borrower | Loan Amount |
|---|---|---|---|
| Previous Owner | Rodriguez Armida | $150,000 |
Source: Public Records
Tax History
| Year | Tax Paid | Tax Assessment Tax Assessment Total Assessment is a certain percentage of the fair market value that is determined by local assessors to be the total taxable value of land and additions on the property. | Land | Improvement |
|---|---|---|---|---|
| 2025 | $2,481 | $121,964 | $41,277 | $80,687 |
| 2024 | $2,481 | $119,573 | $40,468 | $79,105 |
| 2023 | $2,295 | $117,229 | $39,675 | $77,554 |
| 2022 | $2,186 | $114,932 | $38,898 | $76,034 |
| 2021 | $2,136 | $112,680 | $38,136 | $74,544 |
| 2020 | $2,124 | $111,525 | $37,745 | $73,780 |
| 2019 | $2,039 | $109,339 | $37,005 | $72,334 |
| 2018 | $1,895 | $107,196 | $36,280 | $70,916 |
| 2017 | $1,790 | $105,095 | $35,569 | $69,526 |
| 2016 | $1,220 | $103,035 | $34,872 | $68,163 |
| 2015 | $1,204 | $101,489 | $34,349 | $67,140 |
| 2014 | $1,188 | $99,502 | $33,677 | $65,825 |
Source: Public Records
Map
Nearby Homes
Your Personal Tour Guide
Ask me questions while you tour the home.