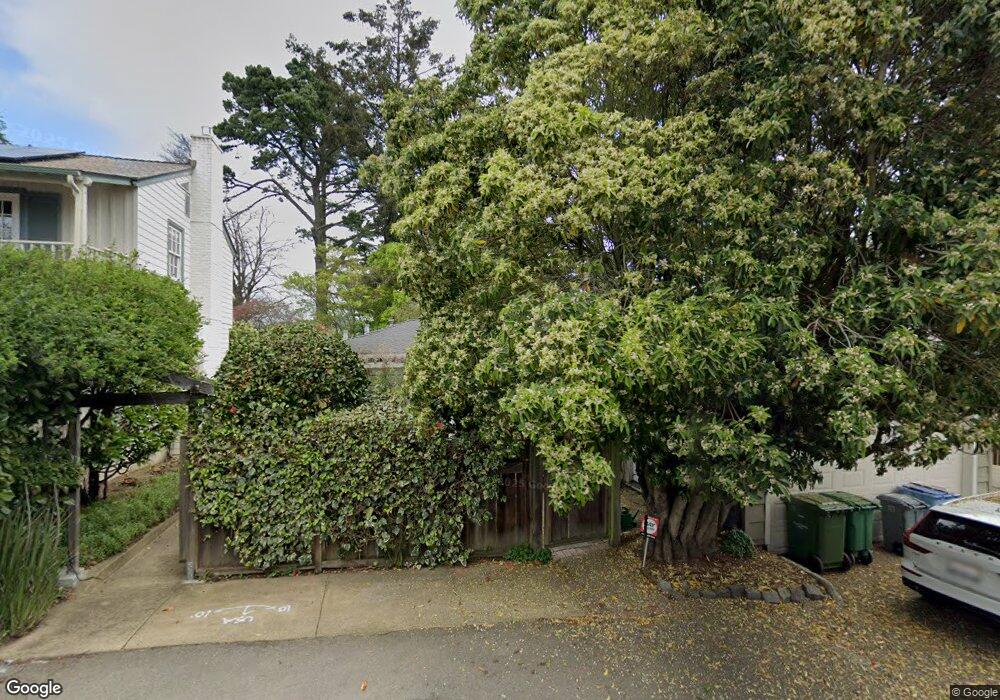
1015 Creston Rd Berkeley, CA 94708
Berkeley Hills NeighborhoodEstimated Value: $1,323,184 - $1,400,000
2
Beds
2
Baths
1,439
Sq Ft
$949/Sq Ft
Est. Value
About This Home
This home is located at 1015 Creston Rd, Berkeley, CA 94708 and is currently estimated at $1,366,296, approximately $949 per square foot. 1015 Creston Rd is a home located in Alameda County with nearby schools including Cragmont Elementary School, Berkeley Arts Magnet at Whittier School, and Washington Elementary School.
Ownership History
Date
Name
Owned For
Owner Type
Purchase Details
Closed on
Jul 16, 2019
Sold by
Mogulof Daniel
Bought by
Mogulof Daniel and Daniel Mogulof Living Trust
Current Estimated Value
Home Financials for this Owner
Home Financials are based on the most recent Mortgage that was taken out on this home.
Original Mortgage
$484,000
Outstanding Balance
$424,027
Interest Rate
3.82%
Mortgage Type
New Conventional
Estimated Equity
$942,269
Purchase Details
Closed on
Sep 6, 2018
Sold by
Mogulof Daniel B
Bought by
Mogulof Daniel and Daniel Mogulof Living Trust
Purchase Details
Closed on
May 22, 2017
Sold by
Wolf Anne M
Bought by
Mogulof Daniel B
Purchase Details
Closed on
Sep 12, 2011
Sold by
Mogulof Daniel B and Wolf Anne M
Bought by
Mogulof Daniel B and Wolf Anne M
Home Financials for this Owner
Home Financials are based on the most recent Mortgage that was taken out on this home.
Original Mortgage
$405,000
Interest Rate
2.87%
Mortgage Type
New Conventional
Purchase Details
Closed on
Aug 29, 2005
Sold by
Mogulof Daniel B
Bought by
Mogulof Daniel B and Wolf Anne M
Purchase Details
Closed on
May 8, 2000
Sold by
Holden Frank Q and Holden Holmes L
Bought by
Mogulof Daniel B
Home Financials for this Owner
Home Financials are based on the most recent Mortgage that was taken out on this home.
Original Mortgage
$472,000
Interest Rate
7.75%
Purchase Details
Closed on
Jul 2, 1997
Sold by
Holden Frank O
Bought by
Holden Frank Q and Frank Q Holden Trust
Purchase Details
Closed on
Jan 19, 1996
Sold by
Whaley Barton S
Bought by
Holden Frank Q and Holden Chris Holmes
Home Financials for this Owner
Home Financials are based on the most recent Mortgage that was taken out on this home.
Original Mortgage
$176,000
Interest Rate
7.18%
Create a Home Valuation Report for This Property
The Home Valuation Report is an in-depth analysis detailing your home's value as well as a comparison with similar homes in the area
Home Values in the Area
Average Home Value in this Area
Purchase History
| Date | Buyer | Sale Price | Title Company |
|---|---|---|---|
| Mogulof Daniel | -- | Old Republic Title Company | |
| Mogulof Daniel | -- | Old Republic Title Company | |
| Mogulof Daniel | -- | None Available | |
| Mogulof Daniel B | -- | None Available | |
| Mogulof Daniel B | -- | Old Republic Title Company B | |
| Mogulof Daniel B | -- | -- | |
| Mogulof Daniel B | $590,000 | Placer Title Company | |
| Holden Frank Q | -- | -- | |
| Holden Frank Q | $220,500 | Old Republic Title Company |
Source: Public Records
Mortgage History
| Date | Status | Borrower | Loan Amount |
|---|---|---|---|
| Open | Mogulof Daniel | $484,000 | |
| Previous Owner | Mogulof Daniel B | $405,000 | |
| Previous Owner | Mogulof Daniel B | $472,000 | |
| Previous Owner | Holden Frank Q | $176,000 |
Source: Public Records
Tax History
| Year | Tax Paid | Tax Assessment Tax Assessment Total Assessment is a certain percentage of the fair market value that is determined by local assessors to be the total taxable value of land and additions on the property. | Land | Improvement |
|---|---|---|---|---|
| 2025 | $13,588 | $899,764 | $272,029 | $634,735 |
| 2024 | $13,588 | $881,987 | $266,696 | $622,291 |
| 2023 | $13,304 | $871,558 | $261,467 | $610,091 |
| 2022 | $13,069 | $847,473 | $256,342 | $598,131 |
| 2021 | $13,101 | $830,722 | $251,316 | $586,406 |
| 2020 | $12,420 | $829,138 | $248,741 | $580,397 |
| 2019 | $11,954 | $812,884 | $243,865 | $569,019 |
| 2018 | $11,755 | $796,947 | $239,084 | $557,863 |
| 2017 | $11,343 | $781,324 | $234,397 | $546,927 |
| 2016 | $10,994 | $766,008 | $229,802 | $536,206 |
| 2015 | $10,848 | $754,503 | $226,351 | $528,152 |
| 2014 | $10,728 | $739,724 | $221,917 | $517,807 |
Source: Public Records
Map
Nearby Homes
- 1024 Grizzly Peak Blvd
- 982 Grizzly Peak Blvd
- 935 Grizzly Peak Blvd
- 1040 Park Hills Rd
- 1100 Miller Ave
- 1119 Miller Ave
- 890 Keeler Ave
- 962 Regal Rd
- 1110 Sterling Ave
- 20 Stevenson Ave
- 1160 Miller Ave
- 1106 Cragmont Ave
- 1155 Keeler Ave
- 1165 Cragmont Ave
- 731 Grizzly Peak Blvd
- 1179 Keith Ave
- 1004 Cragmont Ave
- 1221 Grizzly Peak Blvd
- 777 Cragmont Ave
- 758 Spruce St
- 1019 Creston Rd
- 1009 Creston Rd
- 1005 Creston Rd
- 980 Overlook Rd
- 1031 Creston Rd
- 1001 Creston Rd
- 986 Overlook Rd
- 978 Overlook Rd
- 1020 Creston Rd
- 1010 Creston Rd
- 972 Overlook Rd
- 990 Overlook Rd
- 1030 Creston Rd
- 1039 Creston Rd
- 1000 Creston Rd
- 991 Creston Rd
- 968 Overlook Rd
- 1036 Creston Rd
- 994 Overlook Rd
- 1045 Creston Rd
Your Personal Tour Guide
Ask me questions while you tour the home.