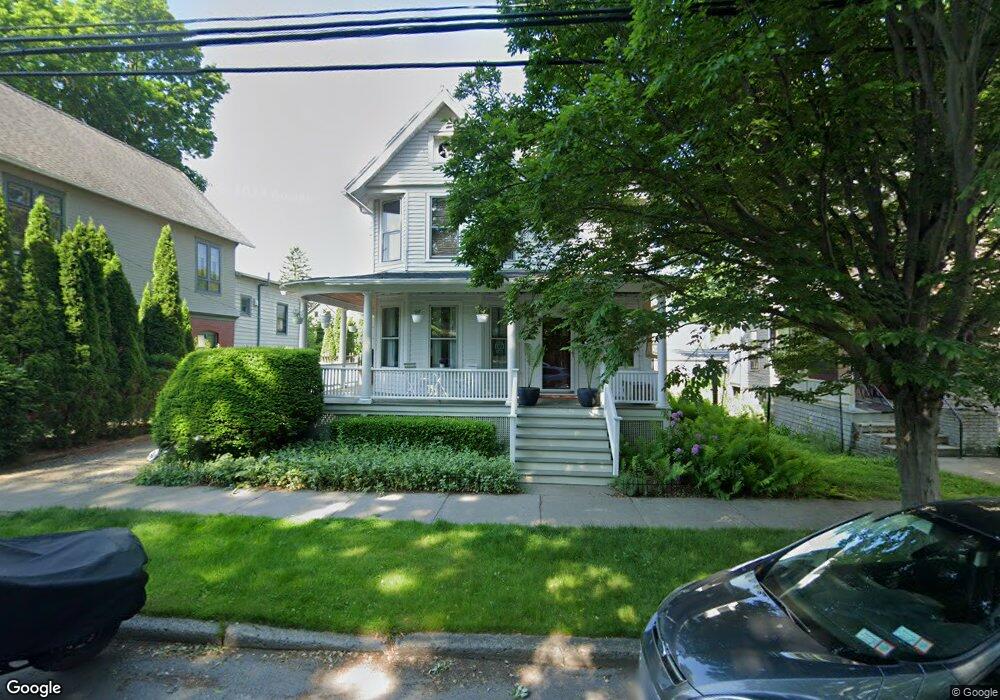
1016 N Tioga St Ithaca, NY 14850
Fall Creek NeighborhoodEstimated Value: $484,000 - $529,654
3
Beds
3
Baths
1,852
Sq Ft
$271/Sq Ft
Est. Value
About This Home
This home is located at 1016 N Tioga St, Ithaca, NY 14850 and is currently estimated at $501,914, approximately $271 per square foot. 1016 N Tioga St is a home located in Tompkins County with nearby schools including Fall Creek Elementary School, Boynton Middle School, and Ithaca Senior High School.
Ownership History
Date
Name
Owned For
Owner Type
Purchase Details
Closed on
Feb 8, 2022
Sold by
Rieser Anna L
Bought by
Brown Margaret C
Current Estimated Value
Home Financials for this Owner
Home Financials are based on the most recent Mortgage that was taken out on this home.
Original Mortgage
$130,000
Outstanding Balance
$120,729
Interest Rate
3.56%
Mortgage Type
Purchase Money Mortgage
Estimated Equity
$381,185
Purchase Details
Closed on
Sep 9, 2010
Sold by
Potter Peter J
Bought by
Canfield Richard L
Home Financials for this Owner
Home Financials are based on the most recent Mortgage that was taken out on this home.
Original Mortgage
$140,000
Interest Rate
4.55%
Mortgage Type
Unknown
Purchase Details
Closed on
Aug 1, 2006
Sold by
Adams Sarah
Bought by
Potter Peter J
Home Financials for this Owner
Home Financials are based on the most recent Mortgage that was taken out on this home.
Original Mortgage
$175,000
Interest Rate
6.67%
Mortgage Type
Unknown
Purchase Details
Closed on
Jun 24, 2004
Sold by
Austen David L & As Ind & Exr
Bought by
Adams Sarah
Purchase Details
Closed on
Dec 9, 2003
Sold by
Austen David L
Bought by
Romanoff Victoria
Create a Home Valuation Report for This Property
The Home Valuation Report is an in-depth analysis detailing your home's value as well as a comparison with similar homes in the area
Home Values in the Area
Average Home Value in this Area
Purchase History
| Date | Buyer | Sale Price | Title Company |
|---|---|---|---|
| Brown Margaret C | $130,000 | None Available | |
| Canfield Richard L | $328,000 | Virginia Tesi | |
| Potter Peter J | $266,000 | Randall B Marcus | |
| Adams Sarah | $150,000 | James A Salk | |
| Romanoff Victoria | $1,000 | -- |
Source: Public Records
Mortgage History
| Date | Status | Borrower | Loan Amount |
|---|---|---|---|
| Open | Brown Margaret C | $130,000 | |
| Previous Owner | Canfield Richard L | $140,000 | |
| Previous Owner | Potter Peter J | $175,000 |
Source: Public Records
Tax History
| Year | Tax Paid | Tax Assessment Tax Assessment Total Assessment is a certain percentage of the fair market value that is determined by local assessors to be the total taxable value of land and additions on the property. | Land | Improvement |
|---|---|---|---|---|
| 2024 | $10,074 | $510,000 | $57,500 | $452,500 |
| 2023 | $9,059 | $440,000 | $57,500 | $382,500 |
| 2022 | $12,860 | $400,000 | $57,500 | $342,500 |
| 2021 | $12,187 | $360,000 | $57,500 | $302,500 |
| 2020 | $7,808 | $360,000 | $57,500 | $302,500 |
| 2019 | $6,356 | $360,000 | $57,500 | $302,500 |
| 2018 | $7,970 | $360,000 | $57,500 | $302,500 |
| 2017 | $8,194 | $360,000 | $35,300 | $324,700 |
| 2016 | $8,272 | $360,000 | $35,300 | $324,700 |
| 2015 | -- | $325,000 | $35,300 | $289,700 |
| 2014 | -- | $325,000 | $35,300 | $289,700 |
Source: Public Records
Map
Nearby Homes
Your Personal Tour Guide
Ask me questions while you tour the home.