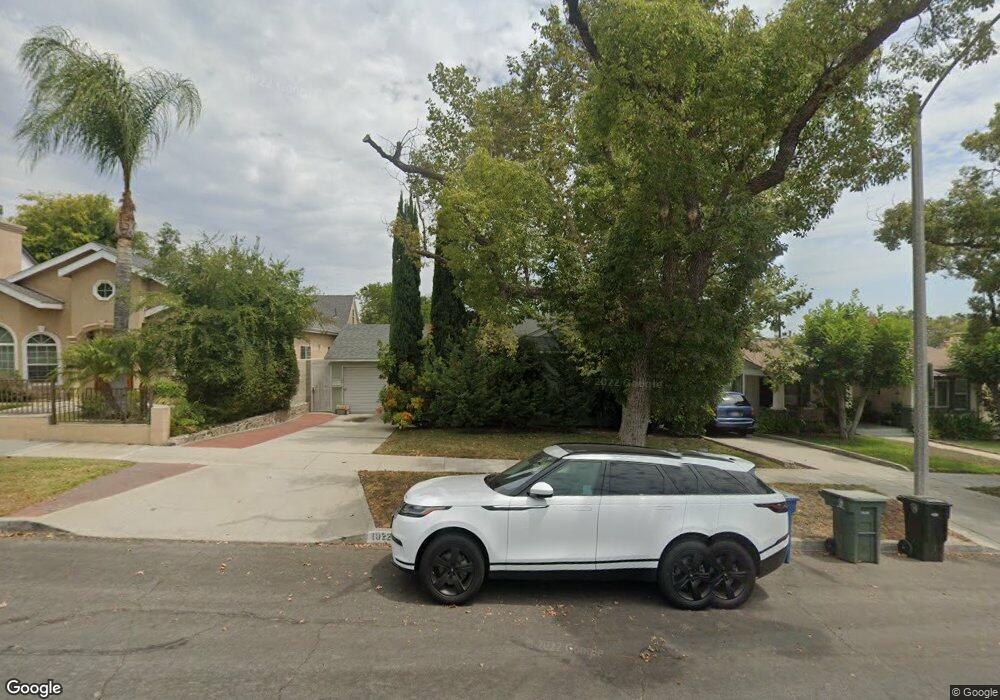
1020 E Verdugo Ave Burbank, CA 91501
Hillside District NeighborhoodEstimated Value: $1,079,000 - $1,453,024
4
Beds
2
Baths
1,541
Sq Ft
$789/Sq Ft
Est. Value
About This Home
This home is located at 1020 E Verdugo Ave, Burbank, CA 91501 and is currently estimated at $1,215,506, approximately $788 per square foot. 1020 E Verdugo Ave is a home located in Los Angeles County with nearby schools including Joaquin Miller Elementary School, John Muir Middle School, and Burbank High School.
Ownership History
Date
Name
Owned For
Owner Type
Purchase Details
Closed on
Nov 18, 2021
Sold by
Albert D Perez Trust
Bought by
Monte C Perez Trust
Current Estimated Value
Purchase Details
Closed on
Aug 20, 2009
Sold by
Perez Albert D and Perez Montair C
Bought by
Perez Albert D and Perez Monte C
Purchase Details
Closed on
Dec 14, 1993
Sold by
Fry Ira Lynn and Fry Katherine L
Bought by
Perez Albert and Perez Monte
Home Financials for this Owner
Home Financials are based on the most recent Mortgage that was taken out on this home.
Original Mortgage
$161,250
Interest Rate
7.2%
Mortgage Type
Seller Take Back
Create a Home Valuation Report for This Property
The Home Valuation Report is an in-depth analysis detailing your home's value as well as a comparison with similar homes in the area
Home Values in the Area
Average Home Value in this Area
Purchase History
| Date | Buyer | Sale Price | Title Company |
|---|---|---|---|
| Monte C Perez Trust | -- | Edwards Marc L | |
| Perez Albert D | -- | None Available | |
| Perez Albert | $215,000 | Gateway Title |
Source: Public Records
Mortgage History
| Date | Status | Borrower | Loan Amount |
|---|---|---|---|
| Previous Owner | Perez Albert | $161,250 |
Source: Public Records
Tax History
| Year | Tax Paid | Tax Assessment Tax Assessment Total Assessment is a certain percentage of the fair market value that is determined by local assessors to be the total taxable value of land and additions on the property. | Land | Improvement |
|---|---|---|---|---|
| 2025 | $8,622 | $753,081 | $578,472 | $174,609 |
| 2024 | $8,325 | $738,316 | $567,130 | $171,186 |
| 2023 | $8,237 | $723,840 | $556,010 | $167,830 |
| 2022 | $3,926 | $344,331 | $240,235 | $104,096 |
| 2021 | $3,905 | $337,580 | $235,525 | $102,055 |
| 2020 | $3,861 | $334,119 | $233,110 | $101,009 |
| 2019 | $3,749 | $327,569 | $228,540 | $99,029 |
| 2018 | $3,693 | $321,147 | $224,059 | $97,088 |
| 2016 | $3,497 | $308,678 | $215,359 | $93,319 |
| 2015 | $3,427 | $304,043 | $212,125 | $91,918 |
| 2014 | $3,430 | $298,088 | $207,970 | $90,118 |
Source: Public Records
Map
Nearby Homes
- 1042 E Tujunga Ave
- 1023 E Elmwood Ave
- 1135 E Verdugo Ave
- 723 E Tujunga Ave
- 12 Skyline Dr
- 828 S Sunset Canyon Dr
- 640 E Elmwood Ave
- 626 E Orange Grove Ave Unit 204
- 615 E Olive Ave Unit A
- 815 E Magnolia Blvd
- 1025 E San Jose Ave
- 0 Country Club Dr Unit SB24168055
- 470 E Angeleno Ave
- 716 E San Jose Ave
- 429 E Providencia Ave Unit B
- 1230 Spazier Ave
- 615 E Magnolia Blvd
- 423 E Providencia Ave
- 1362 Linden Ave
- 330 N 5th St
- 1026 E Verdugo Ave
- 1016 E Verdugo Ave
- 1030 E Verdugo Ave
- 1010 E Verdugo Ave
- 1034 E Verdugo Ave
- 1023 E Santa Anita Ave
- 1027 E Santa Anita Ave
- 1019 E Santa Anita Ave
- 1031 E Santa Anita Ave
- 1015 E Santa Anita Ave
- 1038 E Verdugo Ave
- 1025 E Verdugo Ave
- 1013 E Santa Anita Ave
- 1035 E Santa Anita Ave
- 1011 E Santa Anita Ave
- 1023 E Verdugo Ave
- 404 S Bel Aire Dr
- 410 S Bel Aire Dr
- 1027 E Verdugo Ave
- 1019 E Verdugo Ave
Your Personal Tour Guide
Ask me questions while you tour the home.