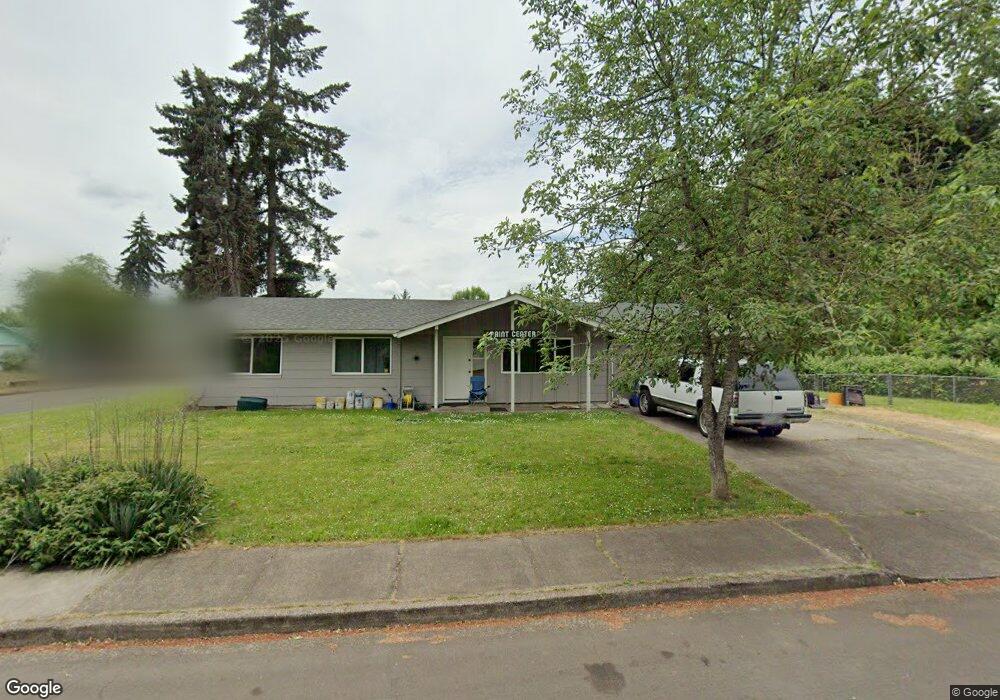
1020 Skipper Ave Eugene, OR 97404
River Road NeighborhoodEstimated Value: $368,000 - $397,647
3
Beds
2
Baths
1,204
Sq Ft
$318/Sq Ft
Est. Value
About This Home
This home is located at 1020 Skipper Ave, Eugene, OR 97404 and is currently estimated at $382,912, approximately $318 per square foot. 1020 Skipper Ave is a home located in Lane County with nearby schools including Howard Elementary School, Kelly Middle School, and North Eugene High School.
Ownership History
Date
Name
Owned For
Owner Type
Purchase Details
Closed on
Apr 30, 2012
Sold by
Chicarino Flavio and Delorefice Dawn
Bought by
Kauble John A and Kauble Susan D
Current Estimated Value
Home Financials for this Owner
Home Financials are based on the most recent Mortgage that was taken out on this home.
Original Mortgage
$93,750
Outstanding Balance
$64,492
Interest Rate
3.9%
Mortgage Type
New Conventional
Estimated Equity
$318,420
Purchase Details
Closed on
Jun 4, 2010
Sold by
Chicarino Flavio
Bought by
Chicarino Flavio and Delorefice Dawn
Purchase Details
Closed on
Jul 25, 2007
Sold by
Chicarino Flavio
Bought by
Chicarino Flavio
Purchase Details
Closed on
Nov 25, 2004
Sold by
Harding Shawn
Bought by
Chicarino Maria Costa
Purchase Details
Closed on
Jun 4, 2001
Sold by
Asbell Tyree E and Asbell Donna R
Bought by
Harding Shawn
Home Financials for this Owner
Home Financials are based on the most recent Mortgage that was taken out on this home.
Original Mortgage
$109,772
Interest Rate
7.14%
Mortgage Type
FHA
Create a Home Valuation Report for This Property
The Home Valuation Report is an in-depth analysis detailing your home's value as well as a comparison with similar homes in the area
Home Values in the Area
Average Home Value in this Area
Purchase History
| Date | Buyer | Sale Price | Title Company |
|---|---|---|---|
| Kauble John A | $125,000 | Cascade Title Company | |
| Chicarino Flavio | -- | Cascade Title Co | |
| Chicarino Flavio | -- | First American | |
| Chicarino Maria Costa | $157,500 | Fidelity National Title Insu | |
| Harding Shawn | $111,500 | Western Pioneer Title Co |
Source: Public Records
Mortgage History
| Date | Status | Borrower | Loan Amount |
|---|---|---|---|
| Open | Kauble John A | $93,750 | |
| Previous Owner | Harding Shawn | $109,772 |
Source: Public Records
Tax History
| Year | Tax Paid | Tax Assessment Tax Assessment Total Assessment is a certain percentage of the fair market value that is determined by local assessors to be the total taxable value of land and additions on the property. | Land | Improvement |
|---|---|---|---|---|
| 2025 | $3,424 | $203,788 | -- | -- |
| 2024 | $3,386 | $197,853 | -- | -- |
| 2023 | $3,386 | $192,091 | $0 | $0 |
| 2022 | $3,185 | $186,497 | $0 | $0 |
| 2021 | $2,962 | $181,066 | $0 | $0 |
| 2020 | $2,983 | $175,793 | $0 | $0 |
| 2019 | $2,878 | $170,673 | $0 | $0 |
| 2018 | $2,684 | $160,876 | $0 | $0 |
| 2017 | $2,503 | $160,876 | $0 | $0 |
| 2016 | $2,368 | $156,190 | $0 | $0 |
| 2015 | $2,279 | $151,641 | $0 | $0 |
| 2014 | $2,267 | $147,224 | $0 | $0 |
Source: Public Records
Map
Nearby Homes
- 541 Durham Ave
- 2563 York St
- 1307 Bramblewood Ln
- 1755 Brentwood Ave
- 805 Impala Ave
- 2488 Northampton
- 303 Lenore Loop
- 2721 La Darrah St
- 1682 Hemlock St
- 401 Sterling Dr
- 2439 Quince St
- 1566 Maywood Ave
- 349 Irving Rd
- 193 Santa Clara Ave
- 215 Jonquil Ave
- 200 Irving Rd
- 1880 Manihi Dr
- 2580 Crowther Dr
- 2610 Crowther Dr
- 389 Maxwell Rd
- 2174 Berwin Ln
- 1110 Skipper Ave
- 1025 Skipper Ave
- 2158 Berwin Ln
- 980 Skipper Ave
- 1075 Skipper Ave
- 2171 Berwin Ln
- 989 Skipper Ave Unit 1
- 989 Skipper Ave
- 1111 Molly Ln
- 1124 Skipper Ave
- 1115 Skipper Ave
- 2155 Berwin Ln
- 1123 Molly Ln
- 955 Skipper Ave
- 2142 Berwin Ln
- 1138 Skipper Ave
- 912 Skipper Ave
- 1100 Molly Ln
- 2176 N Park Ave
Your Personal Tour Guide
Ask me questions while you tour the home.