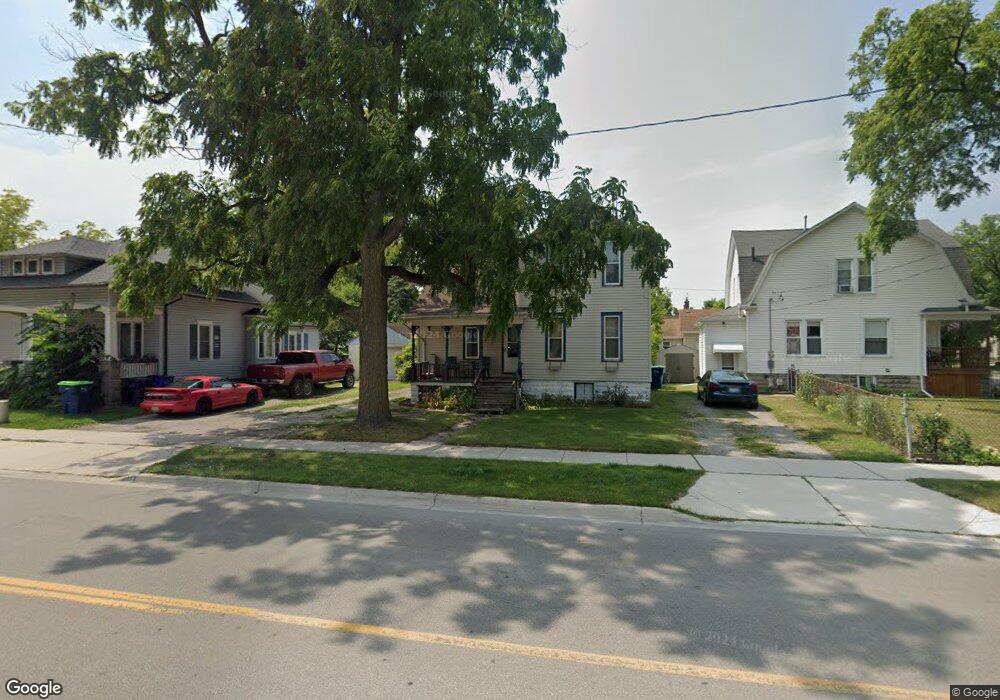
1021 N Trumbull St Bay City, MI 48708
Estimated Value: $79,000 - $124,000
3
Beds
1
Bath
1,278
Sq Ft
$80/Sq Ft
Est. Value
About This Home
This home is located at 1021 N Trumbull St, Bay City, MI 48708 and is currently estimated at $102,777, approximately $80 per square foot. 1021 N Trumbull St is a home located in Bay County with nearby schools including Washington Elementary School, Handy Middle School, and Bay City Central High School.
Ownership History
Date
Name
Owned For
Owner Type
Purchase Details
Closed on
Jan 5, 2024
Sold by
Williamson Matthew S and Williamson Mandy M
Bought by
Williamson Matthew S
Current Estimated Value
Home Financials for this Owner
Home Financials are based on the most recent Mortgage that was taken out on this home.
Original Mortgage
$44,500
Outstanding Balance
$43,770
Interest Rate
7.29%
Mortgage Type
New Conventional
Estimated Equity
$59,007
Purchase Details
Closed on
Dec 29, 2023
Sold by
Strieter Mandy and Williamson Matthew S
Bought by
Williamson Matthew S
Home Financials for this Owner
Home Financials are based on the most recent Mortgage that was taken out on this home.
Original Mortgage
$44,500
Outstanding Balance
$43,770
Interest Rate
7.29%
Mortgage Type
New Conventional
Estimated Equity
$59,007
Purchase Details
Closed on
May 6, 1999
Sold by
Johnson James Patrick
Bought by
Williamson Matthew S and Williamson Mandy M
Create a Home Valuation Report for This Property
The Home Valuation Report is an in-depth analysis detailing your home's value as well as a comparison with similar homes in the area
Home Values in the Area
Average Home Value in this Area
Purchase History
| Date | Buyer | Sale Price | Title Company |
|---|---|---|---|
| Williamson Matthew S | -- | None Listed On Document | |
| Williamson Matthew S | -- | None Listed On Document | |
| Williamson Matthew S | $53,000 | -- |
Source: Public Records
Mortgage History
| Date | Status | Borrower | Loan Amount |
|---|---|---|---|
| Open | Williamson Matthew S | $44,500 | |
| Closed | Williamson Matthew S | $44,500 |
Source: Public Records
Tax History Compared to Growth
Tax History
| Year | Tax Paid | Tax Assessment Tax Assessment Total Assessment is a certain percentage of the fair market value that is determined by local assessors to be the total taxable value of land and additions on the property. | Land | Improvement |
|---|---|---|---|---|
| 2025 | $1,121 | $39,900 | $0 | $0 |
| 2024 | $923 | $36,150 | $0 | $0 |
| 2023 | $878 | $31,150 | $0 | $0 |
| 2022 | $1,009 | $27,450 | $0 | $0 |
| 2021 | $949 | $26,150 | $26,150 | $0 |
| 2020 | $1,009 | $22,650 | $22,650 | $0 |
| 2019 | $987 | $22,100 | $0 | $0 |
| 2018 | $977 | $22,600 | $0 | $0 |
| 2017 | $956 | $22,300 | $0 | $0 |
| 2016 | $951 | $22,500 | $0 | $22,500 |
| 2015 | $924 | $21,100 | $0 | $21,100 |
| 2014 | $924 | $22,450 | $0 | $22,450 |
Source: Public Records
Map
Nearby Homes