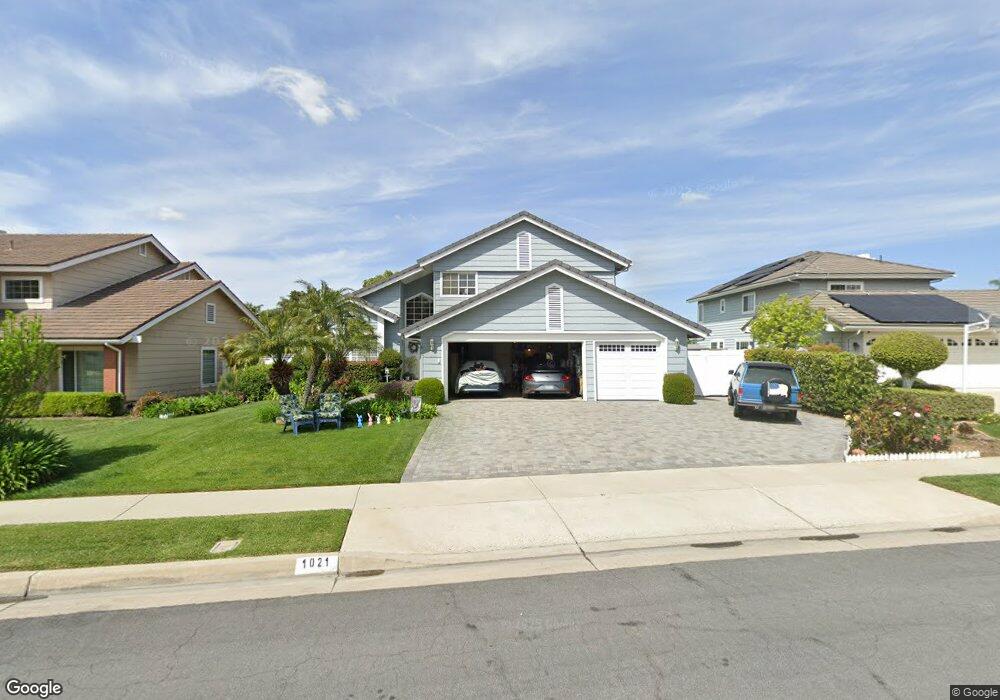
1021 Rashford Dr Placentia, CA 92870
Estimated Value: $1,304,230 - $1,517,000
4
Beds
3
Baths
2,350
Sq Ft
$601/Sq Ft
Est. Value
About This Home
This home is located at 1021 Rashford Dr, Placentia, CA 92870 and is currently estimated at $1,412,808, approximately $601 per square foot. 1021 Rashford Dr is a home located in Orange County with nearby schools including Morse Avenue Elementary School, Kraemer Middle School, and Valencia High School.
Ownership History
Date
Name
Owned For
Owner Type
Purchase Details
Closed on
Jul 9, 2019
Sold by
Western Thomas C and Bracken Sharon Kay
Bought by
Western Thomas C and Bracken Sharon Kay
Current Estimated Value
Purchase Details
Closed on
Apr 4, 2018
Sold by
Bracken Sharon K and Bracken Sharon K
Bought by
Western Thomas C and Western Sharon K
Home Financials for this Owner
Home Financials are based on the most recent Mortgage that was taken out on this home.
Original Mortgage
$235,000
Interest Rate
4.46%
Mortgage Type
New Conventional
Purchase Details
Closed on
Apr 22, 2004
Sold by
Bracken Milton E and Bracken Sharon K
Bought by
Bracken Milton K and Bracken Sharon K
Home Financials for this Owner
Home Financials are based on the most recent Mortgage that was taken out on this home.
Original Mortgage
$314,000
Interest Rate
5.39%
Mortgage Type
New Conventional
Create a Home Valuation Report for This Property
The Home Valuation Report is an in-depth analysis detailing your home's value as well as a comparison with similar homes in the area
Home Values in the Area
Average Home Value in this Area
Purchase History
| Date | Buyer | Sale Price | Title Company |
|---|---|---|---|
| Western Thomas C | -- | None Available | |
| Western Thomas C | -- | Lawyers Title Co | |
| Bracken Milton K | -- | -- |
Source: Public Records
Mortgage History
| Date | Status | Borrower | Loan Amount |
|---|---|---|---|
| Previous Owner | Western Thomas C | $235,000 | |
| Previous Owner | Bracken Milton K | $314,000 |
Source: Public Records
Tax History Compared to Growth
Tax History
| Year | Tax Paid | Tax Assessment Tax Assessment Total Assessment is a certain percentage of the fair market value that is determined by local assessors to be the total taxable value of land and additions on the property. | Land | Improvement |
|---|---|---|---|---|
| 2025 | $5,371 | $436,687 | $112,307 | $324,380 |
| 2024 | $5,371 | $428,125 | $110,105 | $318,020 |
| 2023 | $5,248 | $419,731 | $107,946 | $311,785 |
| 2022 | $5,156 | $411,501 | $105,829 | $305,672 |
| 2021 | $5,020 | $403,433 | $103,754 | $299,679 |
| 2020 | $5,034 | $399,297 | $102,690 | $296,607 |
| 2019 | $4,830 | $391,468 | $100,676 | $290,792 |
| 2018 | $4,765 | $383,793 | $98,702 | $285,091 |
| 2017 | $4,683 | $376,268 | $96,767 | $279,501 |
| 2016 | $4,589 | $368,891 | $94,870 | $274,021 |
| 2015 | $4,528 | $363,350 | $93,445 | $269,905 |
| 2014 | $4,402 | $356,233 | $91,615 | $264,618 |
Source: Public Records
Map
Nearby Homes
- 1018 Violet Cir
- 651 Ziegler Way
- 747 De Jesus Dr
- 918 Doral Ct
- 615 Jensen Place
- 549 Fordham Dr
- 407 Lavender Ln
- 308 Eagle Dr
- 421 Larry Ln
- 754 Stanford Cir
- 420 Augusta Ln
- 988 Spyglass Place
- 744 N Angelina Dr
- 1295 N Kraemer Blvd Unit 23
- 619 E Yorba Linda Blvd
- 607 Valley Forge Dr
- 707 Olivier Dr
- 727 Olivier Dr
- 625 Patten Ave
- 653 Patten Ave
- 1017 Rashford Dr
- 1025 Rashford Dr
- 1102 Naples Ave
- 1108 Naples Ave
- 1013 Rashford Dr
- 1029 Rashford Dr
- 1114 Naples Ave
- 728 Pinehurst Ave
- 1020 Rashford Dr
- 1024 Rashford Dr
- 1016 Rashford Dr
- 1009 Rashford Dr
- 1033 Rashford Dr
- 726 Pinehurst Ave
- 1028 Rashford Dr
- 1012 Rashford Dr
- 719 Pinehurst Ave
- 973 Finnell Way
- 720 Pinehurst Ave
- 1032 Rashford Dr