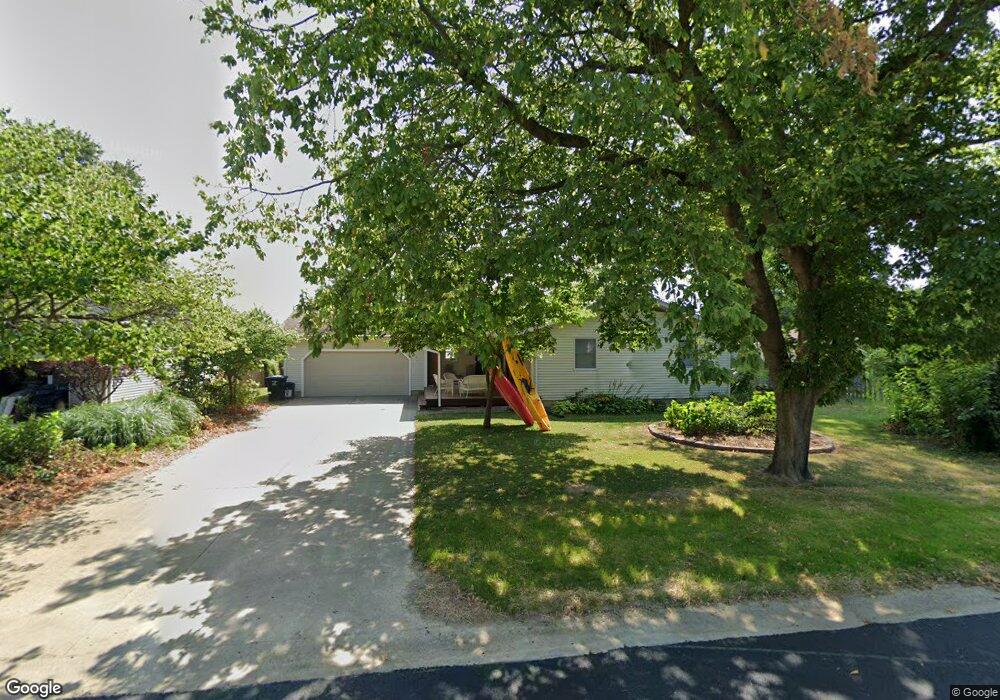
1022 N Main St Effingham, IL 62401
Estimated Value: $248,000 - $458,000
3
Beds
2
Baths
1,798
Sq Ft
$175/Sq Ft
Est. Value
About This Home
This home is located at 1022 N Main St, Effingham, IL 62401 and is currently estimated at $314,413, approximately $174 per square foot. 1022 N Main St is a home located in Effingham County with nearby schools including South Side Grade School, Early Learning Center, and Central Grade School.
Ownership History
Date
Name
Owned For
Owner Type
Purchase Details
Closed on
Mar 23, 2018
Sold by
Althoff Daniel W and Althoff Patsy A
Bought by
Moomaw Kyle L
Current Estimated Value
Home Financials for this Owner
Home Financials are based on the most recent Mortgage that was taken out on this home.
Original Mortgage
$116,000
Outstanding Balance
$99,961
Interest Rate
4.62%
Mortgage Type
New Conventional
Estimated Equity
$214,452
Purchase Details
Closed on
Mar 8, 2016
Sold by
Althoff Daniel William and Althoff Patsy Ann
Bought by
Althoff Daniel W and Althoff Patsy A
Create a Home Valuation Report for This Property
The Home Valuation Report is an in-depth analysis detailing your home's value as well as a comparison with similar homes in the area
Home Values in the Area
Average Home Value in this Area
Purchase History
| Date | Buyer | Sale Price | Title Company |
|---|---|---|---|
| Moomaw Kyle L | $145,000 | Attorney | |
| Althoff Daniel W | -- | None Available |
Source: Public Records
Mortgage History
| Date | Status | Borrower | Loan Amount |
|---|---|---|---|
| Open | Moomaw Kyle L | $116,000 |
Source: Public Records
Tax History Compared to Growth
Tax History
| Year | Tax Paid | Tax Assessment Tax Assessment Total Assessment is a certain percentage of the fair market value that is determined by local assessors to be the total taxable value of land and additions on the property. | Land | Improvement |
|---|---|---|---|---|
| 2024 | $3,870 | $63,280 | $11,030 | $52,250 |
| 2023 | $3,508 | $57,530 | $10,030 | $47,500 |
| 2022 | $3,265 | $52,780 | $9,200 | $43,580 |
| 2021 | $3,355 | $52,260 | $9,110 | $43,150 |
| 2020 | $3,282 | $50,780 | $8,850 | $41,930 |
| 2019 | $3,215 | $50,270 | $8,760 | $41,510 |
| 2018 | $3,532 | $48,330 | $8,420 | $39,910 |
| 2017 | $2,663 | $51,740 | $8,250 | $43,490 |
| 2016 | $2,685 | $50,230 | $8,010 | $42,220 |
| 2015 | -- | $48,770 | $7,780 | $40,990 |
| 2014 | -- | $47,350 | $7,550 | $39,800 |
| 2013 | -- | $46,420 | $7,400 | $39,020 |
| 2012 | -- | $45,730 | $7,290 | $38,440 |
Source: Public Records
Map
Nearby Homes
- 1105 N Merchant St
- 505 W Evergreen Ave
- 100 E Temple Ave
- 406 W Kentucky Ave
- 506 Bent Tree Dr
- 801 N Cleveland St
- 1006 N Koester Dr
- 1201 N Martin St
- 701 Bent Tree Dr
- 805 N Glenwood St
- 702 E North Ave
- 800 E North Ave
- 603 E Saint Louis Ave
- 907 N Ealy St
- 104 S Willow St
- 702 W Fayette Ave
- 407 W Edgar Ave
- 2321 Lilly St
- 710 W Richland Ave
- 0 S Lakewood Dr
- 1024 N Main St
- 1021 N Merchant St
- 1019 N Merchant St
- 1026 N Main St
- 1103 N Merchant St
- 1021 N Main St
- 304 Flamingo Ave
- 1019 N Main St
- 1023 N Main St
- 1025 N Main St
- 400 Flamingo Ave
- 1028 N Main St
- 1107 N Merchant St
- 1027 N Main St
- 402 Flamingo Ave
- 305 Flamingo Ave
- 303 Flamingo Ave
- 1030 N Main St
- 1024 Penguin St
- 1020 Penguin St