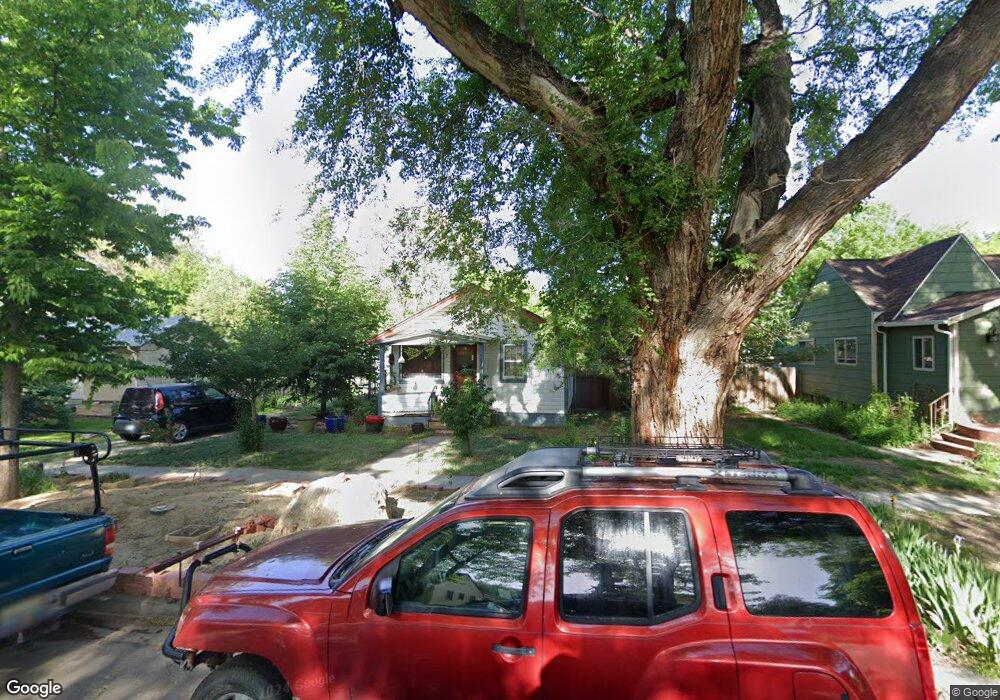
1023 Bross St Longmont, CO 80501
Loomiller NeighborhoodEstimated Value: $382,456 - $435,000
2
Beds
1
Bath
736
Sq Ft
$548/Sq Ft
Est. Value
About This Home
This home is located at 1023 Bross St, Longmont, CO 80501 and is currently estimated at $403,364, approximately $548 per square foot. 1023 Bross St is a home located in Boulder County with nearby schools including Mountain View Elementary School, Longs Peak Middle School, and Longmont High School.
Ownership History
Date
Name
Owned For
Owner Type
Purchase Details
Closed on
Apr 25, 2016
Sold by
Clark Sandra Taimi Ames
Bought by
Clark Sandra Taimi Ames
Current Estimated Value
Home Financials for this Owner
Home Financials are based on the most recent Mortgage that was taken out on this home.
Original Mortgage
$180,800
Outstanding Balance
$144,257
Interest Rate
3.73%
Mortgage Type
New Conventional
Estimated Equity
$259,107
Purchase Details
Closed on
Jan 12, 2007
Sold by
Mcchesney Nicholas T and Mcchesney Wanda Jean
Bought by
Clark Sandra Taimi Ames
Home Financials for this Owner
Home Financials are based on the most recent Mortgage that was taken out on this home.
Original Mortgage
$113,600
Interest Rate
6.09%
Mortgage Type
Unknown
Purchase Details
Closed on
Jan 31, 1997
Sold by
Mcchesney Nicholas T
Bought by
Mcchesney Nicholas T
Purchase Details
Closed on
Aug 30, 1974
Bought by
Clark Sandra Taimi Ames and Clark Phillip I
Create a Home Valuation Report for This Property
The Home Valuation Report is an in-depth analysis detailing your home's value as well as a comparison with similar homes in the area
Home Values in the Area
Average Home Value in this Area
Purchase History
| Date | Buyer | Sale Price | Title Company |
|---|---|---|---|
| Clark Sandra Taimi Ames | -- | Stewart Title | |
| Clark Sandra Taimi Ames | $142,000 | None Available | |
| Mcchesney Nicholas T | -- | -- | |
| Clark Sandra Taimi Ames | $17,000 | -- |
Source: Public Records
Mortgage History
| Date | Status | Borrower | Loan Amount |
|---|---|---|---|
| Open | Clark Sandra Taimi Ames | $180,800 | |
| Closed | Clark Sandra Taimi Ames | $113,600 |
Source: Public Records
Tax History Compared to Growth
Tax History
| Year | Tax Paid | Tax Assessment Tax Assessment Total Assessment is a certain percentage of the fair market value that is determined by local assessors to be the total taxable value of land and additions on the property. | Land | Improvement |
|---|---|---|---|---|
| 2025 | $1,946 | $22,013 | $5,369 | $16,644 |
| 2024 | $1,946 | $22,013 | $5,369 | $16,644 |
| 2023 | $1,919 | $20,341 | $5,983 | $18,043 |
| 2022 | $1,785 | $18,042 | $4,399 | $13,643 |
| 2021 | $1,808 | $18,561 | $4,526 | $14,035 |
| 2020 | $1,759 | $18,111 | $3,933 | $14,178 |
| 2019 | $1,732 | $18,111 | $3,933 | $14,178 |
| 2018 | $1,412 | $14,868 | $3,528 | $11,340 |
| 2017 | $1,393 | $16,437 | $3,900 | $12,537 |
| 2016 | $1,256 | $13,142 | $4,856 | $8,286 |
| 2015 | $1,197 | $10,507 | $3,343 | $7,164 |
| 2014 | $981 | $10,507 | $3,343 | $7,164 |
Source: Public Records
Map
Nearby Homes
- 1012 Pratt St Unit 1012
- 1136 Venice St
- 1019 Alta St Unit 1019
- 1209 Gay St
- 1214 9th Ave
- 1217 Lincoln St
- 814 Gay St
- 1314 Venice St
- 1247 Lincoln St
- 900 Mountain View Ave Unit 213
- 1061 Townley Cir
- 818 Lincoln St
- 1344 Aspen Place
- 1147 Emery St
- 1224 Judson St
- 1202 Vivian St
- 820 Kimbark St Unit D
- 623 Pratt St
- 1153 Vivian St
- 836 Emery St