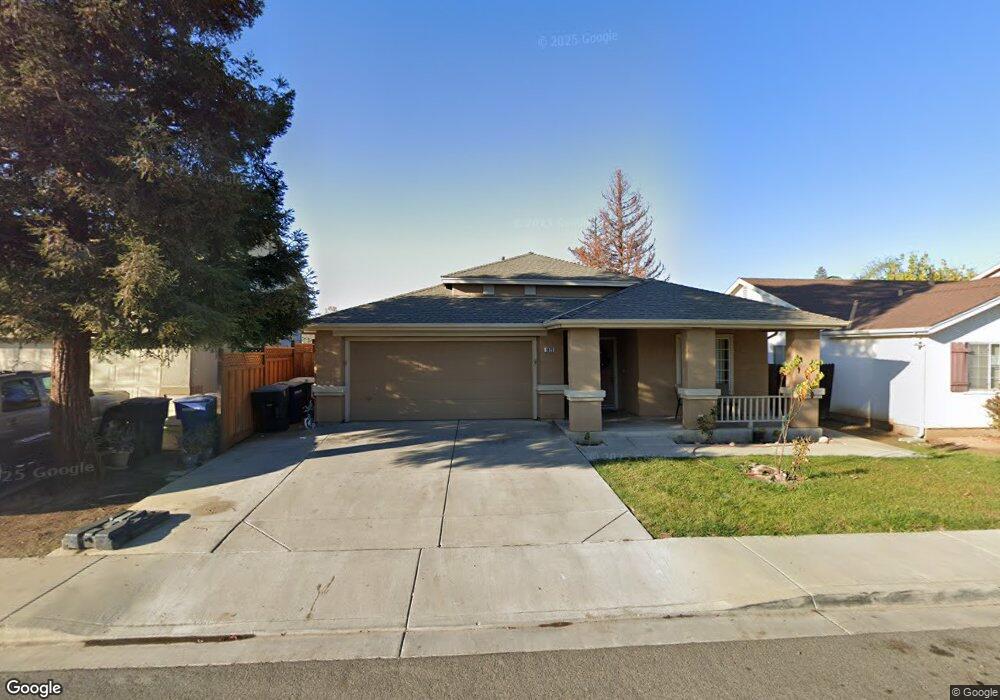
1023 Sparrow Hawk Ln Patterson, CA 95363
Estimated Value: $426,000 - $504,000
4
Beds
2
Baths
1,773
Sq Ft
$265/Sq Ft
Est. Value
About This Home
This home is located at 1023 Sparrow Hawk Ln, Patterson, CA 95363 and is currently estimated at $470,410, approximately $265 per square foot. 1023 Sparrow Hawk Ln is a home located in Stanislaus County with nearby schools including Northmead Elementary School, Creekside Middle School, and Patterson High School.
Ownership History
Date
Name
Owned For
Owner Type
Purchase Details
Closed on
Dec 20, 2018
Sold by
Pacheco Antoniao M and Pacheco Rosa
Bought by
Pacheco Joe and Pacheco Antoniom
Current Estimated Value
Purchase Details
Closed on
Sep 14, 2001
Sold by
Pacheco Antonio M and Pacheco Rosa
Bought by
Pacheco Antonio M and Pacheco Rosa
Purchase Details
Closed on
Apr 4, 2001
Sold by
Wilson Matthew J and Wilson Jadie L
Bought by
Pacheo Antonio M and Pacheo Rosa
Purchase Details
Closed on
Jul 6, 1998
Sold by
Kaufman & Broad Central Valley Inc
Bought by
Wilson Matthew J and Lewis Jadie L
Home Financials for this Owner
Home Financials are based on the most recent Mortgage that was taken out on this home.
Original Mortgage
$120,399
Interest Rate
7.03%
Mortgage Type
FHA
Create a Home Valuation Report for This Property
The Home Valuation Report is an in-depth analysis detailing your home's value as well as a comparison with similar homes in the area
Home Values in the Area
Average Home Value in this Area
Purchase History
| Date | Buyer | Sale Price | Title Company |
|---|---|---|---|
| Pacheco Joe | -- | None Available | |
| Pacheco Antonio M | -- | -- | |
| Pacheo Antonio M | $209,000 | Fidelity National Title Co | |
| Wilson Matthew J | $123,500 | First American Title Ins Co |
Source: Public Records
Mortgage History
| Date | Status | Borrower | Loan Amount |
|---|---|---|---|
| Previous Owner | Wilson Matthew J | $120,399 |
Source: Public Records
Tax History Compared to Growth
Tax History
| Year | Tax Paid | Tax Assessment Tax Assessment Total Assessment is a certain percentage of the fair market value that is determined by local assessors to be the total taxable value of land and additions on the property. | Land | Improvement |
|---|---|---|---|---|
| 2025 | $4,088 | $331,139 | $87,492 | $243,647 |
| 2024 | $4,072 | $324,647 | $85,777 | $238,870 |
| 2023 | $3,980 | $318,283 | $84,096 | $234,187 |
| 2022 | $4,380 | $312,044 | $82,448 | $229,596 |
| 2021 | $4,320 | $305,927 | $80,832 | $225,095 |
| 2020 | $4,317 | $302,791 | $80,004 | $222,787 |
| 2019 | $4,255 | $296,855 | $78,436 | $218,419 |
| 2018 | $3,924 | $276,771 | $72,831 | $203,940 |
| 2017 | $3,845 | $271,345 | $71,403 | $199,942 |
| 2016 | $3,418 | $236,000 | $70,000 | $166,000 |
| 2015 | $3,335 | $226,500 | $41,500 | $185,000 |
| 2014 | $3,211 | $218,000 | $40,000 | $178,000 |
Source: Public Records
Map
Nearby Homes
- 522 Osprey Dr
- 440 Eider Dr
- 1137 Blue Heron Dr
- 609 Roadrunner Dr
- 1224 Kingfisher Dr
- 216 Barros St
- 106 Barros St
- 1127 Kestrel Dr
- 1154 Kestrel Dr
- 326 N 4th St
- 470 J St
- 1314 Sutter Creek Ct
- 1325 Beaver Creek Dr
- 1132 Marsh Wren Ct
- 1219 Wigeon Dr
- 432 Meadow Creek Dr
- 375 I St
- 1363 Snake Creek Dr
- 23 S 5th St
- 15707 S 9th St
- 1027 Sparrow Hawk Ln
- 1024 Goldfinch Ln
- 1031 Sparrow Hawk Ln
- 1015 Sparrow Hawk Ln
- 1028 Goldfinch Ln
- 1020 Goldfinch Ln
- 1032 Goldfinch Ln
- 1016 Goldfinch Ln
- 1022 Sparrow Hawk Ln
- 1035 Sparrow Hawk Ln
- 1018 Sparrow Hawk Ln
- 1026 Sparrow Hawk Ln
- 1014 Sparrow Hawk Ln
- 1036 Goldfinch Ln
- 1030 Sparrow Hawk Ln
- 1012 Goldfinch Ln
- 1010 Sparrow Hawk Ln
- 1034 Sparrow Hawk Ln
- 1025 Goldfinch Ln
- 1021 Goldfinch Ln