Estimated Value: $458,000 - $659,000
4
Beds
2
Baths
1,459
Sq Ft
$374/Sq Ft
Est. Value
About This Home
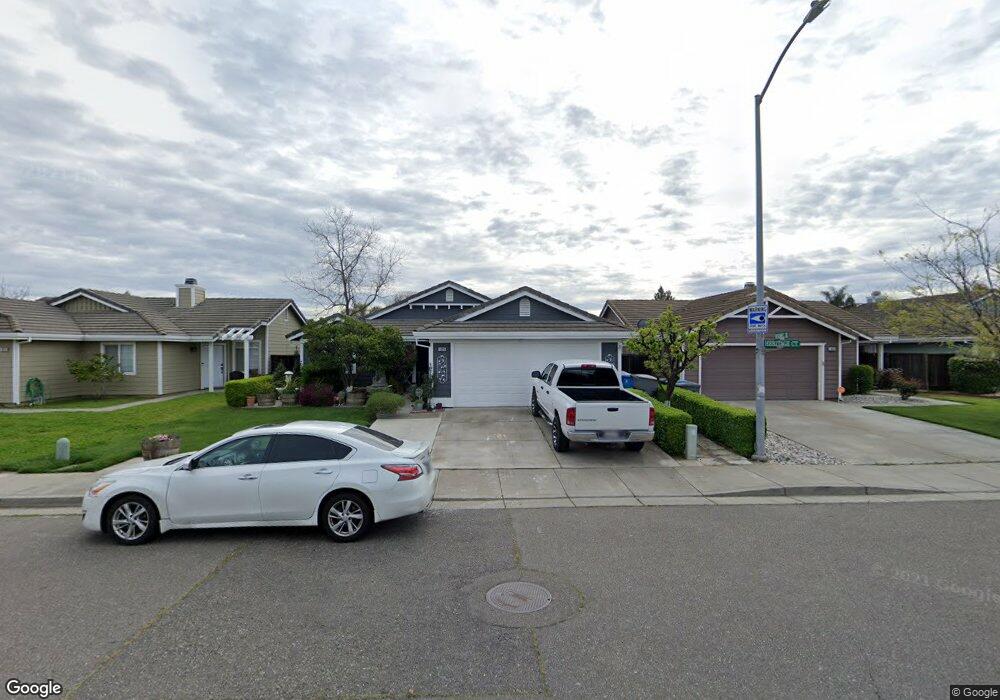
This home is located at 1025 Windmill Dr, Dixon, CA 95620 and is currently estimated at $546,090, approximately $374 per square foot. 1025 Windmill Dr is a home located in Solano County with nearby schools including Anderson (Linford L.) Elementary School, Dixon High School, and Dixon Montessori Charter.
Ownership History
Date
Name
Owned For
Owner Type
Purchase Details
Closed on
Jul 15, 2024
Sold by
Saucedo-Rosas Lucio and Saucedo Eloisa
Bought by
Lucio Saucedo-Rosas And Eloisa Saucedo Revoca and Saucedo-Rosas
Current Estimated Value
Purchase Details
Closed on
Aug 5, 2005
Sold by
Garcia Juan Enrique Hernandez
Bought by
Saucero Rosas Lucio and Saucedo Eloisa
Purchase Details
Closed on
Aug 27, 1998
Sold by
Saucedo Rosas Lucio and Saucedo Eloisa
Bought by
Saucedo Rosas Lucio and Saucedo Eloisa
Home Financials for this Owner
Home Financials are based on the most recent Mortgage that was taken out on this home.
Original Mortgage
$114,570
Interest Rate
7.01%
Mortgage Type
FHA
Purchase Details
Closed on
Jul 13, 1998
Sold by
Housing Group Northern Calif
Bought by
Saucedo Rosas Lucio and Saucedo Eloisa
Home Financials for this Owner
Home Financials are based on the most recent Mortgage that was taken out on this home.
Original Mortgage
$114,570
Interest Rate
7.01%
Mortgage Type
FHA
Create a Home Valuation Report for This Property
The Home Valuation Report is an in-depth analysis detailing your home's value as well as a comparison with similar homes in the area
Home Values in the Area
Average Home Value in this Area
Purchase History
| Date | Buyer | Sale Price | Title Company |
|---|---|---|---|
| Lucio Saucedo-Rosas And Eloisa Saucedo Revoca | -- | None Listed On Document | |
| Saucero Rosas Lucio | -- | -- | |
| Saucedo Rosas Lucio | -- | -- | |
| Saucedo Rosas Lucio | $139,000 | Frontier Title Company |
Source: Public Records
Mortgage History
| Date | Status | Borrower | Loan Amount |
|---|---|---|---|
| Previous Owner | Saucedo Rosas Lucio | $114,570 |
Source: Public Records
Tax History
| Year | Tax Paid | Tax Assessment Tax Assessment Total Assessment is a certain percentage of the fair market value that is determined by local assessors to be the total taxable value of land and additions on the property. | Land | Improvement |
|---|---|---|---|---|
| 2025 | $2,424 | $222,667 | $78,379 | $144,288 |
| 2024 | $2,424 | $218,302 | $76,843 | $141,459 |
| 2023 | $2,352 | $214,023 | $75,337 | $138,686 |
| 2022 | $2,317 | $209,827 | $73,861 | $135,966 |
| 2021 | $2,287 | $205,713 | $72,413 | $133,300 |
| 2020 | $2,250 | $203,605 | $71,671 | $131,934 |
| 2019 | $2,207 | $199,614 | $70,266 | $129,348 |
| 2018 | $2,198 | $195,701 | $68,889 | $126,812 |
| 2017 | $2,142 | $191,865 | $67,539 | $124,326 |
| 2016 | $2,043 | $188,104 | $66,215 | $121,889 |
| 2015 | $1,996 | $185,280 | $65,221 | $120,059 |
| 2014 | $1,974 | $181,652 | $63,944 | $117,708 |
Source: Public Records
Map
Nearby Homes
- 950 Norton Ct
- 1205 Cornell Ct
- 1130 Legion Ct
- 1245 Pacific Place
- 560 Syracuse Ln
- 515 W Cherry St
- 1440 Folsom Downs Cir
- 225 E Chestnut St
- 1305 Valley Glen Dr
- 230 E Walnut St
- 745 Jasmine St
- 1325 Valley Glen Dr
- 241 S 1st St
- 305 S 8th St
- 240 S 7th St
- 625 Cypress St
- 1565 Halsey Ct
- 1532 Base Ct
- 970 Camelia Dr
- 409 W C St
- 1035 Windmill Dr
- 1015 Windmill Dr
- 1020 Orchard Dr
- 1045 Windmill Dr
- 1005 Windmill Dr
- 1030 Orchard Dr
- 1010 Orchard Dr
- 1040 Orchard Dr
- 1000 Orchard Dr
- 1055 Windmill Dr
- 1000 Heritage Ct
- 1030 Windmill Dr
- 1050 Orchard Dr
- 1040 Windmill Dr
- 1065 Windmill Dr
- 1010 Heritage Ct
- 1050 Windmill Dr
- 1060 Orchard Dr
- 995 Windmill Dr
- 1025 Orchard Dr
Your Personal Tour Guide
Ask me questions while you tour the home.