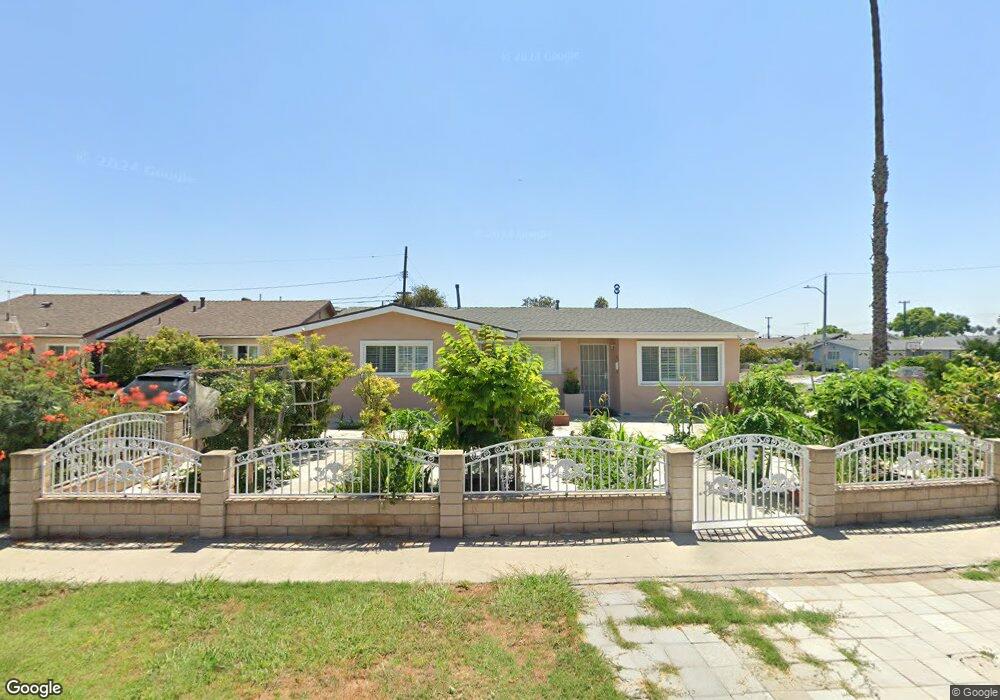
10272 Jennrich Ave Garden Grove, CA 92843
Little Saigon NeighborhoodEstimated Value: $981,000 - $1,037,000
4
Beds
2
Baths
1,342
Sq Ft
$746/Sq Ft
Est. Value
About This Home
This home is located at 10272 Jennrich Ave, Garden Grove, CA 92843 and is currently estimated at $1,001,215, approximately $746 per square foot. 10272 Jennrich Ave is a home located in Orange County with nearby schools including Morningside Elementary School, James Irvine Intermediate School, and Bolsa Grande High School.
Ownership History
Date
Name
Owned For
Owner Type
Purchase Details
Closed on
Sep 17, 2011
Sold by
Acacia Capital Investment Llc
Bought by
Vannguyen Ben and Nguyen Wendy Huyen
Current Estimated Value
Home Financials for this Owner
Home Financials are based on the most recent Mortgage that was taken out on this home.
Original Mortgage
$200,000
Outstanding Balance
$79,125
Interest Rate
4.37%
Mortgage Type
New Conventional
Estimated Equity
$922,090
Purchase Details
Closed on
May 11, 2011
Sold by
Alvarado Carlos S and Alvarado Bertha R
Bought by
Acacia Capital Investment Llc
Purchase Details
Closed on
Dec 18, 2003
Sold by
Ho Steven
Bought by
Alvarado Carlos S and Alvarado Bertha R
Home Financials for this Owner
Home Financials are based on the most recent Mortgage that was taken out on this home.
Original Mortgage
$405,000
Interest Rate
6.5%
Mortgage Type
Purchase Money Mortgage
Purchase Details
Closed on
Sep 20, 1996
Sold by
Hieu Duong Tony and Duong Laura Loan Dao
Bought by
Ho Steven
Create a Home Valuation Report for This Property
The Home Valuation Report is an in-depth analysis detailing your home's value as well as a comparison with similar homes in the area
Home Values in the Area
Average Home Value in this Area
Purchase History
| Date | Buyer | Sale Price | Title Company |
|---|---|---|---|
| Vannguyen Ben | $420,000 | Lawyers Title | |
| Acacia Capital Investment Llc | $348,500 | None Available | |
| Alvarado Carlos S | $479,000 | Security Union Title | |
| Ho Steven | $143,000 | Fidelity National Title Ins |
Source: Public Records
Mortgage History
| Date | Status | Borrower | Loan Amount |
|---|---|---|---|
| Open | Vannguyen Ben | $200,000 | |
| Previous Owner | Alvarado Carlos S | $405,000 |
Source: Public Records
Tax History Compared to Growth
Tax History
| Year | Tax Paid | Tax Assessment Tax Assessment Total Assessment is a certain percentage of the fair market value that is determined by local assessors to be the total taxable value of land and additions on the property. | Land | Improvement |
|---|---|---|---|---|
| 2025 | $7,605 | $608,730 | $459,085 | $149,645 |
| 2024 | $7,605 | $596,795 | $450,084 | $146,711 |
| 2023 | $7,464 | $585,094 | $441,259 | $143,835 |
| 2022 | $7,305 | $573,622 | $432,607 | $141,015 |
| 2021 | $7,228 | $562,375 | $424,125 | $138,250 |
| 2020 | $6,252 | $482,367 | $419,776 | $62,591 |
| 2019 | $5,999 | $472,909 | $411,545 | $61,364 |
| 2018 | $5,879 | $463,637 | $403,476 | $60,161 |
| 2017 | $5,799 | $454,547 | $395,565 | $58,982 |
| 2016 | $5,511 | $445,635 | $387,809 | $57,826 |
| 2015 | $5,435 | $438,942 | $381,984 | $56,958 |
| 2014 | $5,303 | $430,344 | $374,501 | $55,843 |
Source: Public Records
Map
Nearby Homes
- 14171 Flower St
- 10061 15th St
- 9906 13th St
- 14151 Lake St
- 9884 11th St
- 14356 Taft St
- 10886 Lotus Dr
- 9936 Pear Dr
- 13322 Euclid St
- 5317 Silver Dr
- 812 N Euclid St
- 9851 Bolsa Ave Unit 198
- 9851 Bolsa Ave Unit 196
- 14376 Euclid St Unit 1-4
- 5405 W 4th St
- 14362 Bushard St Unit 39
- 14362 Bushard St Unit 109
- 10632 Henderson Ave
- 9800 Bolsa Ave Unit 14
- 13611 Glenhaven Dr
- 10282 Jennrich Ave
- 10271 Mcclure Ave
- 10302 Jennrich Ave
- 10291 Mcclure Ave
- 14291 Deanann Place
- 14301 Deanann Place
- 10271 Jennrich Ave
- 10281 Jennrich Ave
- 10251 Jennrich Ave
- 10301 Mcclure Ave
- 10312 Jennrich Ave
- 14311 Deanann Place
- 10291 Jennrich Ave
- 10241 Jennrich Ave
- 10311 Mcclure Ave
- 10311 Jennrich Ave
- 14331 Deanann Place
- 10222 Jennrich Ave
- 10322 Jennrich Ave
- 10231 Jennrich Ave