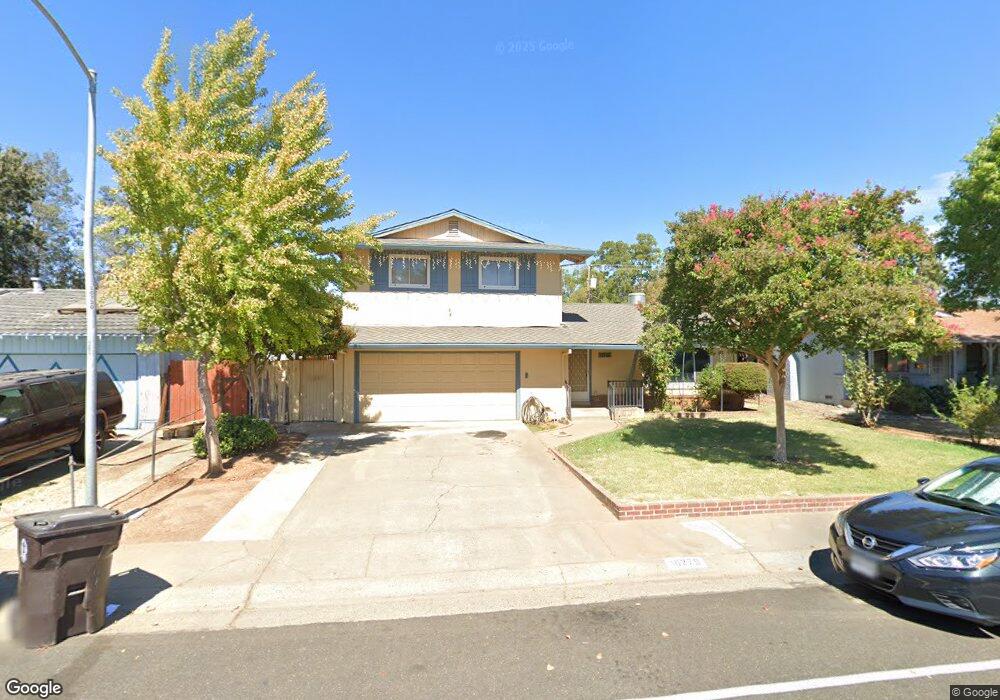
10279 Croydon Way Rancho Cordova, CA 95670
White Rock NeighborhoodEstimated Value: $128,000 - $457,000
3
Beds
2
Baths
1,447
Sq Ft
$251/Sq Ft
Est. Value
About This Home
This home is located at 10279 Croydon Way, Rancho Cordova, CA 95670 and is currently estimated at $362,593, approximately $250 per square foot. 10279 Croydon Way is a home located in Sacramento County with nearby schools including White Rock Elementary School, Mills Middle School, and Cordova High School.
Ownership History
Date
Name
Owned For
Owner Type
Purchase Details
Closed on
Aug 26, 2021
Sold by
Tyler Tyresha A
Bought by
Tyler Tyresha A
Current Estimated Value
Home Financials for this Owner
Home Financials are based on the most recent Mortgage that was taken out on this home.
Original Mortgage
$260,000
Outstanding Balance
$236,581
Interest Rate
2.8%
Mortgage Type
New Conventional
Estimated Equity
$126,012
Purchase Details
Closed on
Oct 26, 2010
Sold by
Tran Long Thi
Bought by
Tyler Tyresha A
Home Financials for this Owner
Home Financials are based on the most recent Mortgage that was taken out on this home.
Original Mortgage
$118,405
Interest Rate
4.5%
Mortgage Type
FHA
Purchase Details
Closed on
Feb 4, 2010
Sold by
Vanle Hung
Bought by
Tran Long Thi
Purchase Details
Closed on
Aug 8, 2007
Sold by
Tran Long Thi and Vanle Hung Van
Bought by
Hung Tran Long Thi and Hung Van Le
Purchase Details
Closed on
Jul 6, 2006
Sold by
Le Thuc Doan Nguyen
Bought by
Le Toan Minh
Purchase Details
Closed on
Jun 29, 2005
Sold by
Tran Long Thi
Bought by
Vanle Hung and Tran Long Thi
Home Financials for this Owner
Home Financials are based on the most recent Mortgage that was taken out on this home.
Original Mortgage
$120,000
Interest Rate
5.84%
Mortgage Type
New Conventional
Purchase Details
Closed on
May 19, 2005
Sold by
Le Hung
Bought by
Tran Long Thi
Home Financials for this Owner
Home Financials are based on the most recent Mortgage that was taken out on this home.
Original Mortgage
$120,000
Interest Rate
5.84%
Mortgage Type
New Conventional
Purchase Details
Closed on
Dec 24, 2001
Sold by
Le Toan and Le Hung
Bought by
Le Hung and Tran Long
Home Financials for this Owner
Home Financials are based on the most recent Mortgage that was taken out on this home.
Original Mortgage
$85,000
Interest Rate
6.51%
Purchase Details
Closed on
Oct 10, 1997
Sold by
The United States Of America
Bought by
Le Hung and Tran Long
Home Financials for this Owner
Home Financials are based on the most recent Mortgage that was taken out on this home.
Original Mortgage
$82,822
Interest Rate
7.49%
Mortgage Type
FHA
Purchase Details
Closed on
Apr 24, 1997
Sold by
Richards Thierry M and Richards Young S
Bought by
The United States Of America
Purchase Details
Closed on
Apr 9, 1997
Sold by
Va
Bought by
Richards Thierry M and Richards Young S
Create a Home Valuation Report for This Property
The Home Valuation Report is an in-depth analysis detailing your home's value as well as a comparison with similar homes in the area
Home Values in the Area
Average Home Value in this Area
Purchase History
| Date | Buyer | Sale Price | Title Company |
|---|---|---|---|
| Tyler Tyresha A | -- | Fidelity Natl Ttl Orange Cnt | |
| Tyler Tyresha A | -- | Fidelity Natl Ttl Orange Cnt | |
| Tyler Tyresha A | $120,000 | North American Title Co Inc | |
| Tran Long Thi | -- | None Available | |
| Hung Tran Long Thi | -- | None Available | |
| Le Toan Minh | -- | None Available | |
| Vanle Hung | -- | None Available | |
| Vanle Hung | -- | -- | |
| Tran Long Thi | -- | Chicago Title Co | |
| Le Hung | -- | Fidelity National Title Co | |
| Le Hung | $84,000 | Sacramento Title Company | |
| The United States Of America | -- | Sacramento Title Company | |
| Richards Thierry M | -- | Sacramento Title Company |
Source: Public Records
Mortgage History
| Date | Status | Borrower | Loan Amount |
|---|---|---|---|
| Open | Tyler Tyresha A | $260,000 | |
| Closed | Tyler Tyresha A | $260,000 | |
| Closed | Tyler Tyresha A | $118,405 | |
| Previous Owner | Tran Long Thi | $120,000 | |
| Previous Owner | Le Hung | $85,000 | |
| Previous Owner | Le Hung | $82,822 |
Source: Public Records
Tax History Compared to Growth
Tax History
| Year | Tax Paid | Tax Assessment Tax Assessment Total Assessment is a certain percentage of the fair market value that is determined by local assessors to be the total taxable value of land and additions on the property. | Land | Improvement |
|---|---|---|---|---|
| 2025 | $1,798 | $153,727 | $64,052 | $89,675 |
| 2024 | $1,798 | $150,714 | $62,797 | $87,917 |
| 2023 | $1,761 | $147,760 | $61,566 | $86,194 |
| 2022 | $1,736 | $144,863 | $60,359 | $84,504 |
| 2021 | $6,181 | $142,024 | $59,176 | $82,848 |
| 2020 | $6,169 | $140,569 | $58,570 | $81,999 |
| 2019 | $6,140 | $137,814 | $57,422 | $80,392 |
| 2018 | $1,615 | $135,113 | $56,297 | $78,816 |
| 2017 | $1,573 | $132,465 | $55,194 | $77,271 |
| 2016 | $1,525 | $129,868 | $54,112 | $75,756 |
| 2015 | $1,746 | $127,919 | $53,300 | $74,619 |
| 2014 | $1,850 | $125,414 | $52,256 | $73,158 |
Source: Public Records
Map
Nearby Homes
- 3231 Nosler Ct
- 2701 El Caprice Dr
- 10204 Malaga Way
- 10035 Mills Station Rd
- 10035 Mills Station Rd Unit 136
- 10035 Mills Station Rd Unit 153
- 2629 La Loma Dr
- 10233 Countryside Way
- 10470 Spaulding Way
- 47 Temple
- 60 Count Way
- 10472 Abbottford Way
- 10433 Rockingham Dr
- 10167 Country Way
- 10276 S White Rock Rd
- 2904 Poole Dr
- 146 Lord Way
- 2926 Poole Dr Unit 25
- 10048 El Chorlito Dr
- 2644 Tronero Way
- 10275 Croydon Way
- 10283 Croydon Way
- 10266 Mills Station Rd
- 10271 Croydon Way
- 10287 Croydon Way
- 10278 Croydon Way
- 10258 Mills Station Rd
- 10282 Croydon Way
- 10267 Croydon Way
- 10274 Croydon Way
- 10286 Croydon Way
- 10248 Mills Station Rd
- 10270 Croydon Way
- 10263 Croydon Way
- 10266 Croydon Way
- 2985 Portsmouth Dr
- 3017 Margate Way
- 3004 Portsmouth Dr
- 2981 Portsmouth Dr
- 3013 Margate Way