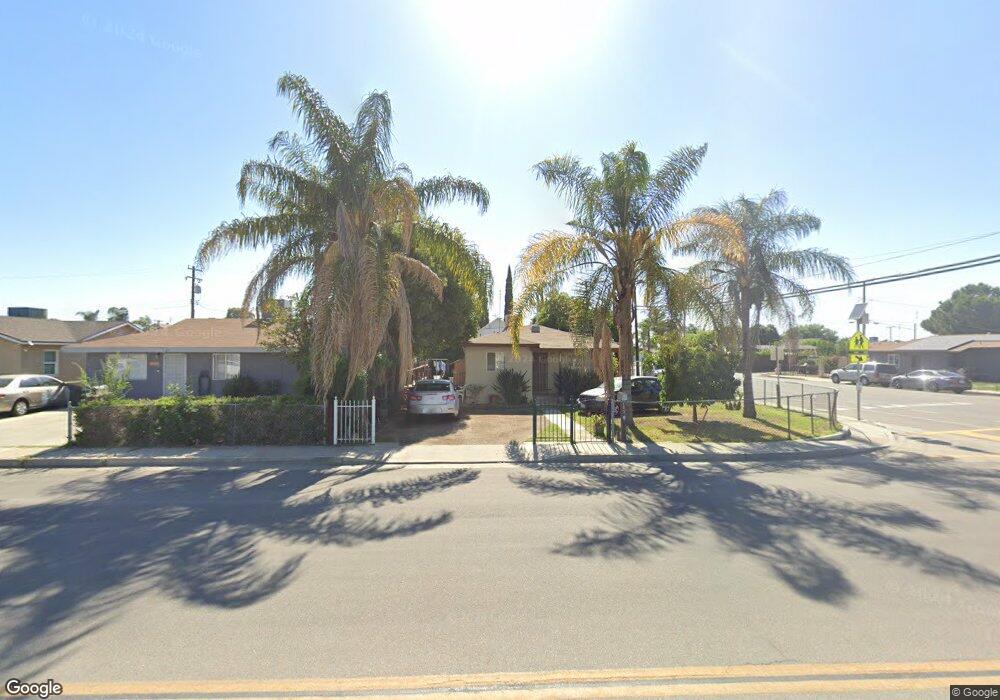
1029 Dover St Delano, CA 93215
West Delano NeighborhoodEstimated Value: $213,000 - $237,844
4
Beds
1
Bath
986
Sq Ft
$227/Sq Ft
Est. Value
About This Home
This home is located at 1029 Dover St, Delano, CA 93215 and is currently estimated at $223,461, approximately $226 per square foot. 1029 Dover St is a home located in Kern County with nearby schools including Fremont Elementary School, Almond Tree Middle School, and Cesar E. Chavez High School.
Ownership History
Date
Name
Owned For
Owner Type
Purchase Details
Closed on
Aug 28, 2008
Sold by
Contreras Jesus and Contreras Maria Magdalena
Bought by
Contreras Jesus and Contreras Maria Magdalena
Current Estimated Value
Home Financials for this Owner
Home Financials are based on the most recent Mortgage that was taken out on this home.
Original Mortgage
$15,100
Outstanding Balance
$10,077
Interest Rate
6.59%
Mortgage Type
New Conventional
Estimated Equity
$213,384
Purchase Details
Closed on
Oct 16, 1997
Sold by
Alva Maria and Benavides Jose
Bought by
Contreras Jesus and Contreras Maria Magdalena
Home Financials for this Owner
Home Financials are based on the most recent Mortgage that was taken out on this home.
Original Mortgage
$67,582
Interest Rate
7.19%
Mortgage Type
FHA
Purchase Details
Closed on
Jun 24, 1997
Sold by
Alva Maria and Alva Manuel V
Bought by
Alva Maria and Benavides Jose
Create a Home Valuation Report for This Property
The Home Valuation Report is an in-depth analysis detailing your home's value as well as a comparison with similar homes in the area
Home Values in the Area
Average Home Value in this Area
Purchase History
| Date | Buyer | Sale Price | Title Company |
|---|---|---|---|
| Contreras Jesus | -- | Chicago Title Company | |
| Contreras Jesus | $67,500 | Fidelity National Title Co | |
| Alva Maria | -- | -- |
Source: Public Records
Mortgage History
| Date | Status | Borrower | Loan Amount |
|---|---|---|---|
| Open | Contreras Jesus | $15,100 | |
| Previous Owner | Contreras Jesus | $67,582 |
Source: Public Records
Tax History
| Year | Tax Paid | Tax Assessment Tax Assessment Total Assessment is a certain percentage of the fair market value that is determined by local assessors to be the total taxable value of land and additions on the property. | Land | Improvement |
|---|---|---|---|---|
| 2025 | $834 | $59,847 | $27,133 | $32,714 |
| 2024 | $808 | $58,674 | $26,601 | $32,073 |
| 2023 | $808 | $57,525 | $26,080 | $31,445 |
| 2022 | $790 | $56,398 | $25,569 | $30,829 |
| 2021 | $728 | $55,293 | $25,068 | $30,225 |
| 2020 | $714 | $54,727 | $24,811 | $29,916 |
| 2019 | $703 | $54,727 | $24,811 | $29,916 |
| 2018 | $694 | $52,604 | $23,849 | $28,755 |
| 2017 | $699 | $51,574 | $23,382 | $28,192 |
| 2016 | $688 | $50,564 | $22,924 | $27,640 |
| 2015 | $710 | $49,805 | $22,580 | $27,225 |
| 2014 | $666 | $48,830 | $22,138 | $26,692 |
Source: Public Records
Map
Nearby Homes
- 901 Belmont St
- 301 Stork Ct Unit Lot 97
- 441 14th Ave
- 142 W 11th Place
- 1417 Ellington St
- 146 W 11th Place
- 1942 Clinton St
- 622 Dover St
- 609 Dover St
- 602 Dover Place
- 1407 High St
- 0 S High St
- 1024 Main St
- 432 Dover Place
- 1010 Main St
- 1018 Main St
- 1020 Main St
- 420 Dover Place
- 814 Encanto Way
- 430 Fremont St
Your Personal Tour Guide
Ask me questions while you tour the home.