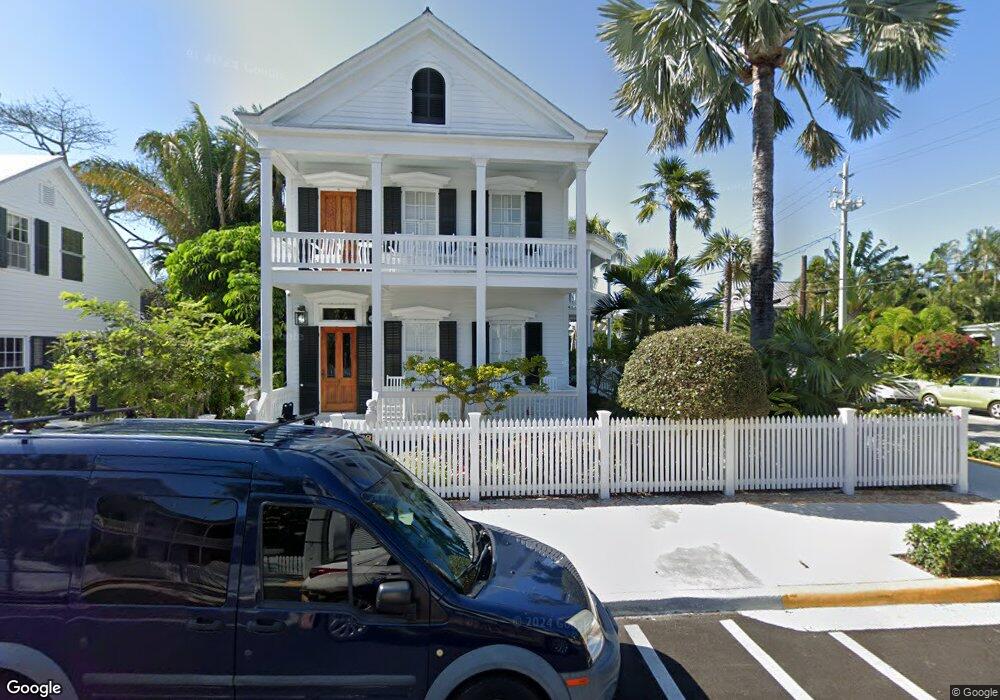
1029 Fleming St Key West, FL 33040
Old Town NeighborhoodEstimated Value: $4,795,000 - $5,939,000
4
Beds
3
Baths
3,233
Sq Ft
$1,652/Sq Ft
Est. Value
About This Home
This home is located at 1029 Fleming St, Key West, FL 33040 and is currently estimated at $5,340,161, approximately $1,651 per square foot. 1029 Fleming St is a home located in Monroe County with nearby schools including Gerald Adams Elementary School, Key West High School, and Somerset Island Prep.
Ownership History
Date
Name
Owned For
Owner Type
Purchase Details
Closed on
Jun 19, 2013
Sold by
Charters Russell John
Bought by
Pilar At Fleming Llc
Current Estimated Value
Purchase Details
Closed on
Jan 20, 2005
Sold by
Nona Daniel A and Russell John C
Bought by
Russell John Charters and Russell Nona Daniel
Purchase Details
Closed on
Jan 24, 2003
Sold by
Nash Mary G
Bought by
Nona Daniel A and Russell John C
Purchase Details
Closed on
May 5, 1998
Sold by
R R B
Bought by
Nash Mary G
Home Financials for this Owner
Home Financials are based on the most recent Mortgage that was taken out on this home.
Original Mortgage
$279,000
Interest Rate
7.03%
Mortgage Type
New Conventional
Purchase Details
Closed on
Jun 1, 1993
Bought by
Pilar At Fleming Llc
Create a Home Valuation Report for This Property
The Home Valuation Report is an in-depth analysis detailing your home's value as well as a comparison with similar homes in the area
Home Values in the Area
Average Home Value in this Area
Purchase History
| Date | Buyer | Sale Price | Title Company |
|---|---|---|---|
| Pilar At Fleming Llc | $3,650,000 | Attorney | |
| Russell John Charters | -- | -- | |
| Nona Daniel A | $1,350,000 | -- | |
| Nash Mary G | $100 | -- | |
| Pilar At Fleming Llc | $400,000 | -- |
Source: Public Records
Mortgage History
| Date | Status | Borrower | Loan Amount |
|---|---|---|---|
| Previous Owner | Nash Mary G | $150,000 | |
| Previous Owner | Nash Mary G | $279,000 |
Source: Public Records
Tax History
| Year | Tax Paid | Tax Assessment Tax Assessment Total Assessment is a certain percentage of the fair market value that is determined by local assessors to be the total taxable value of land and additions on the property. | Land | Improvement |
|---|---|---|---|---|
| 2025 | $36,846 | $4,572,587 | $1,874,842 | $2,697,745 |
| 2024 | $34,154 | $4,581,400 | $1,874,842 | $2,706,558 |
| 2023 | $34,154 | $4,206,418 | $1,607,171 | $2,599,247 |
| 2022 | $30,760 | $3,844,997 | $1,217,728 | $2,627,269 |
| 2021 | $28,903 | $3,251,781 | $900,659 | $2,351,122 |
| 2020 | $28,981 | $3,269,851 | $893,766 | $2,376,085 |
| 2019 | $29,311 | $3,277,751 | $942,016 | $2,335,735 |
| 2018 | $28,717 | $3,228,392 | $829,434 | $2,398,958 |
| 2017 | $27,797 | $3,291,614 | $0 | $0 |
| 2016 | $25,485 | $2,629,161 | $0 | $0 |
| 2015 | $23,574 | $2,321,585 | $0 | $0 |
| 2014 | $24,166 | $2,284,690 | $0 | $0 |
Source: Public Records
Map
Nearby Homes
- 1108 Curry Ln
- 1109 Stump Ln
- 1113 Stump Ln
- 1022 Fleming St
- 3 Nassau Ln Unit A
- 1020 Fleming St
- 1109 Fleming St
- 1115 Fleming St
- 530 White St
- 413 Frances St
- 1110 Elgin Ln
- 1116 Elgin Ln
- 1006 Fleming St
- 1014 Southard St
- 1116 Eaton St
- 1118 Eaton St
- 611 Grinnell St Unit 4
- 508 Grinnell St
- 409 Grinnell St
- 1015 Eaton St
- 414 Frances St
- 1021 Fleming St
- 1101 Fleming St
- 1022 Elgin Ln
- 1103 Fleming St
- 425 Frances St
- 425 Frances St Unit 3
- 425 Frances St Unit 2
- 425 Frances St Unit 1
- 1017 Fleming St
- 415 Frances St
- 1107 Fleming St
- 1020 Fleming St Unit Street
- 1030 Fleming St
- 1022 Fleming St Unit Lower
- 1108 Fleming St
- 1 Nassau Ln
- 1100 Fleming St
- 409 Frances St
- 1104 Elgin Ln
Your Personal Tour Guide
Ask me questions while you tour the home.