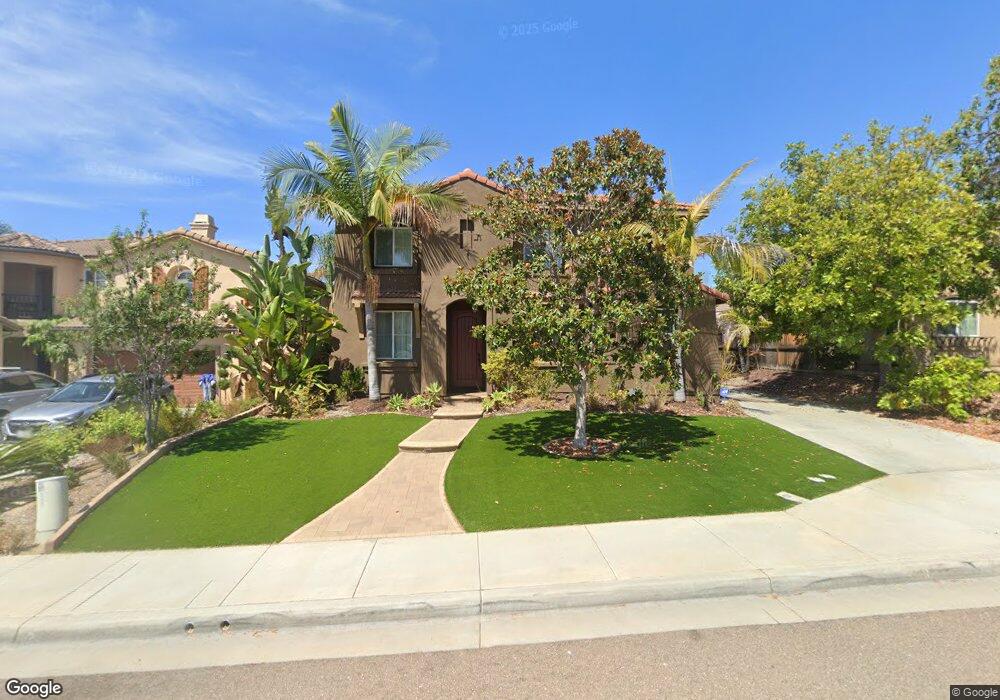
1029 Sundial Ct Oceanside, CA 92057
North Valley NeighborhoodEstimated Value: $1,142,000 - $1,186,000
5
Beds
4
Baths
3,533
Sq Ft
$331/Sq Ft
Est. Value
About This Home
This home is located at 1029 Sundial Ct, Oceanside, CA 92057 and is currently estimated at $1,171,024, approximately $331 per square foot. 1029 Sundial Ct is a home located in San Diego County with nearby schools including Bonsall West Elementary School, Sullivan Middle School, and Bonsall High.
Ownership History
Date
Name
Owned For
Owner Type
Purchase Details
Closed on
Nov 16, 2006
Sold by
Fieldstone Spyglass Llc
Bought by
Perez Jessy and Perez Nohelia M
Current Estimated Value
Home Financials for this Owner
Home Financials are based on the most recent Mortgage that was taken out on this home.
Original Mortgage
$640,424
Interest Rate
5.5%
Mortgage Type
New Conventional
Create a Home Valuation Report for This Property
The Home Valuation Report is an in-depth analysis detailing your home's value as well as a comparison with similar homes in the area
Home Values in the Area
Average Home Value in this Area
Purchase History
| Date | Buyer | Sale Price | Title Company |
|---|---|---|---|
| Perez Jessy | $753,500 | First American Title |
Source: Public Records
Mortgage History
| Date | Status | Borrower | Loan Amount |
|---|---|---|---|
| Previous Owner | Perez Jessy | $640,424 |
Source: Public Records
Tax History
| Year | Tax Paid | Tax Assessment Tax Assessment Total Assessment is a certain percentage of the fair market value that is determined by local assessors to be the total taxable value of land and additions on the property. | Land | Improvement |
|---|---|---|---|---|
| 2025 | $13,005 | $1,009,379 | $428,702 | $580,677 |
| 2024 | $13,005 | $989,589 | $420,297 | $569,292 |
| 2023 | $12,725 | $970,186 | $412,056 | $558,130 |
| 2022 | $12,548 | $951,164 | $403,977 | $547,187 |
| 2021 | $10,353 | $740,000 | $309,000 | $431,000 |
| 2020 | $9,949 | $700,000 | $293,000 | $407,000 |
| 2019 | $9,849 | $690,000 | $289,000 | $401,000 |
| 2018 | $9,812 | $670,000 | $281,000 | $389,000 |
| 2017 | $70 | $610,000 | $256,000 | $354,000 |
| 2016 | $9,051 | $570,000 | $240,000 | $330,000 |
| 2015 | $8,852 | $550,000 | $232,000 | $318,000 |
| 2014 | $8,797 | $535,000 | $226,000 | $309,000 |
Source: Public Records
Map
Nearby Homes
- 1039 Eliot St
- 924 Glendora Dr
- 1121 Midnight Way
- 1241 Breakaway Dr
- 1491 Pilgrim Way
- 1486 Puritan Way
- 868 Panella Ct
- 1359 Corte Alveo
- 0 Indian View Dr
- 671 Parker St
- 656 Parker St
- 1058 Village Dr
- 5133 Greenbrook St
- 663 Charles Dr
- 5450 Alexandrine Ct
- 1120 Championship Rd
- 273 Stallion Dr
- 569 Gold Dr
- 290 Hadley Way
- 5015 Macario Dr
- 1033 Sundial Ct
- 1025 Sundial Ct
- 1037 Sundial Ct
- 1021 Sundial Ct
- 1050 Fields Ct
- 1041 Sundial Ct
- 1017 Sundial Ct
- 1054 Fields Ct
- 1051 Fields Ct
- 1045 Sundial Ct
- 1013 Sundial Ct
- 1055 Fields Ct
- 1073 Boulder Place
- 1059 Fields Ct
- 1049 Sundial Ct
- 1009 Sundial Ct
- 1145 Parkview Dr
- 1149 Parkview Dr
- 1153 Parkview Dr
- 1005 Sundial Ct
Your Personal Tour Guide
Ask me questions while you tour the home.