103 Jamaica St Springfield, MA 01119
Boston Road NeighborhoodEstimated Value: $313,000 - $379,000
3
Beds
1
Bath
1,464
Sq Ft
$232/Sq Ft
Est. Value
About This Home
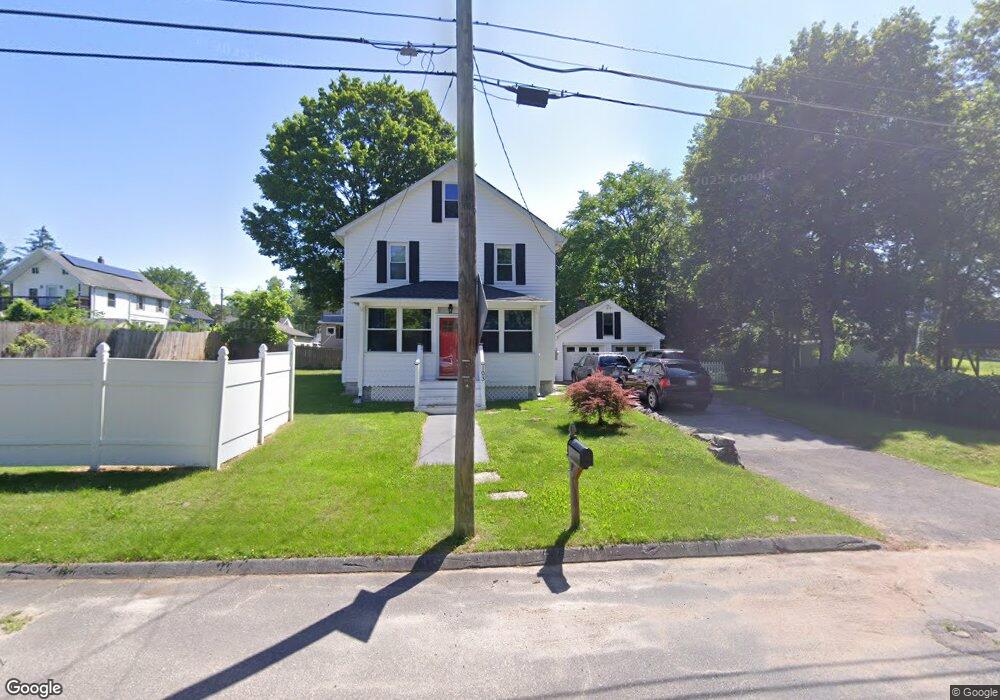
This home is located at 103 Jamaica St, Springfield, MA 01119 and is currently estimated at $340,010, approximately $232 per square foot. 103 Jamaica St is a home located in Hampden County with nearby schools including Warner, M Marcus Kiley Middle, and Springfield Central High School.
Ownership History
Date
Name
Owned For
Owner Type
Purchase Details
Closed on
Oct 29, 2020
Sold by
Murphy Karen D and Booker Deborah Y
Bought by
Booker Deborah Y
Current Estimated Value
Home Financials for this Owner
Home Financials are based on the most recent Mortgage that was taken out on this home.
Original Mortgage
$120,600
Outstanding Balance
$106,826
Interest Rate
2.8%
Mortgage Type
New Conventional
Estimated Equity
$233,184
Purchase Details
Closed on
Apr 30, 2013
Sold by
Booker Deborah Y
Bought by
Booker Deborah Y and Murphy Karen D
Home Financials for this Owner
Home Financials are based on the most recent Mortgage that was taken out on this home.
Original Mortgage
$105,671
Interest Rate
3.64%
Mortgage Type
New Conventional
Purchase Details
Closed on
Jan 9, 2013
Sold by
Murphy Bessie E
Bought by
Booker Deborah Y
Create a Home Valuation Report for This Property
The Home Valuation Report is an in-depth analysis detailing your home's value as well as a comparison with similar homes in the area
Home Values in the Area
Average Home Value in this Area
Purchase History
| Date | Buyer | Sale Price | Title Company |
|---|---|---|---|
| Booker Deborah Y | -- | None Available | |
| Booker Deborah Y | -- | -- | |
| Booker Deborah Y | -- | -- | |
| Booker Deborah Y | -- | -- |
Source: Public Records
Mortgage History
| Date | Status | Borrower | Loan Amount |
|---|---|---|---|
| Open | Booker Deborah Y | $120,600 | |
| Previous Owner | Booker Deborah Y | $105,671 |
Source: Public Records
Tax History
| Year | Tax Paid | Tax Assessment Tax Assessment Total Assessment is a certain percentage of the fair market value that is determined by local assessors to be the total taxable value of land and additions on the property. | Land | Improvement |
|---|---|---|---|---|
| 2025 | $4,720 | $301,000 | $45,900 | $255,100 |
| 2024 | $4,604 | $286,700 | $43,000 | $243,700 |
| 2023 | $4,147 | $243,200 | $40,900 | $202,300 |
| 2022 | $3,871 | $205,700 | $40,900 | $164,800 |
| 2021 | $3,676 | $194,500 | $37,200 | $157,300 |
| 2020 | $3,568 | $182,700 | $37,200 | $145,500 |
| 2019 | $3,493 | $177,500 | $37,200 | $140,300 |
| 2018 | $3,261 | $165,700 | $37,200 | $128,500 |
| 2017 | $3,250 | $165,300 | $37,200 | $128,100 |
| 2016 | $2,809 | $142,900 | $37,200 | $105,700 |
| 2015 | $2,789 | $141,800 | $37,200 | $104,600 |
Source: Public Records
Map
Nearby Homes
Your Personal Tour Guide
Ask me questions while you tour the home.