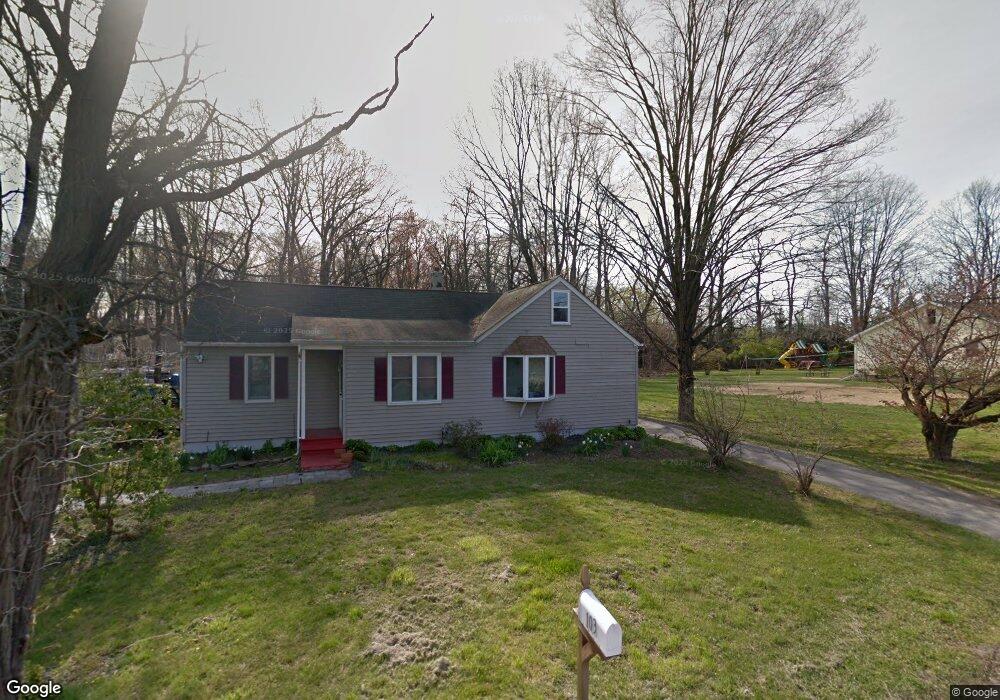
103 Osborne Hill Rd Fishkill, NY 12524
Estimated Value: $306,000 - $464,000
4
Beds
3
Baths
1,164
Sq Ft
$336/Sq Ft
Est. Value
About This Home
This home is located at 103 Osborne Hill Rd, Fishkill, NY 12524 and is currently estimated at $391,538, approximately $336 per square foot. 103 Osborne Hill Rd is a home located in Dutchess County with nearby schools including Fishkill Elementary School, Van Wyck Junior High School, and John Jay Senior High School.
Ownership History
Date
Name
Owned For
Owner Type
Purchase Details
Closed on
May 16, 2019
Sold by
Fishkill Homes Llc
Bought by
Srpk Llc
Current Estimated Value
Purchase Details
Closed on
Apr 23, 2019
Sold by
Brady Kelly and Fishkill Homes Llc
Bought by
Fishkill Homes Llc
Purchase Details
Closed on
Aug 14, 2013
Sold by
Joy Susan
Bought by
Joy Jason
Purchase Details
Closed on
Jan 31, 2011
Sold by
Joy Susan
Bought by
Joy Susan
Home Financials for this Owner
Home Financials are based on the most recent Mortgage that was taken out on this home.
Original Mortgage
$227,755
Interest Rate
4%
Mortgage Type
Purchase Money Mortgage
Purchase Details
Closed on
Sep 24, 1998
Sold by
Reimer Bernard Raymond and Reimer Carol S
Bought by
Joy Susan M
Create a Home Valuation Report for This Property
The Home Valuation Report is an in-depth analysis detailing your home's value as well as a comparison with similar homes in the area
Home Values in the Area
Average Home Value in this Area
Purchase History
| Date | Buyer | Sale Price | Title Company |
|---|---|---|---|
| Srpk Llc | $176,000 | -- | |
| Srpk Llc | $176,000 | -- | |
| Fishkill Homes Llc | $136,001 | First American Title | |
| Fishkill Homes Llc | $136,001 | First American Title | |
| Joy Jason | -- | -- | |
| Joy Jason | -- | -- | |
| Joy Susan | -- | -- | |
| Joy Susan | -- | -- | |
| Joy Susan M | $129,000 | -- | |
| Joy Susan M | $129,000 | -- |
Source: Public Records
Mortgage History
| Date | Status | Borrower | Loan Amount |
|---|---|---|---|
| Previous Owner | Joy Susan | $227,755 |
Source: Public Records
Tax History Compared to Growth
Tax History
| Year | Tax Paid | Tax Assessment Tax Assessment Total Assessment is a certain percentage of the fair market value that is determined by local assessors to be the total taxable value of land and additions on the property. | Land | Improvement |
|---|---|---|---|---|
| 2024 | $5,507 | $280,900 | $97,700 | $183,200 |
| 2023 | $7,647 | $262,200 | $97,700 | $164,500 |
| 2022 | $7,112 | $237,300 | $88,900 | $148,400 |
| 2021 | $6,678 | $217,700 | $79,100 | $138,600 |
| 2020 | $4,835 | $201,500 | $70,300 | $131,200 |
| 2019 | $4,117 | $201,500 | $70,300 | $131,200 |
| 2018 | $4,267 | $201,500 | $70,300 | $131,200 |
| 2017 | $4,079 | $194,900 | $70,300 | $124,600 |
| 2016 | $3,981 | $189,700 | $70,300 | $119,400 |
| 2015 | -- | $189,700 | $70,300 | $119,400 |
| 2014 | -- | $196,300 | $88,400 | $107,900 |
Source: Public Records
Map
Nearby Homes
- 101 Osborne Hill Rd
- 17 Fleetwood Dr
- 12 Ronsue Dr
- 121 Cooper Rd
- 27 Osborne Hill Rd
- 12 Berghoff Dr
- 174 Smithtown Rd
- 19 Stevenkay Place
- 203 Windsor Rd
- 275 Osborne Hill Rd
- 25 Mac Farlane Rd
- 37 Scarborough Ln Unit A
- 21 Carnaby St Unit C
- 15 Carnaby St Unit D
- 1 Carnaby St Unit C
- 8 Scarborough Ln Unit B
- 20 Aspen Ct
- 33 Aspen Ct
- 30 Givens Ln
- 9 White Gate Rd Unit J
- 113 Osborne Hill Rd
- 0 Osborne Hill Rd Unit 266784
- 0 Osborne Hill Rd Unit 264384
- 0 Osborne Hill Rd Unit 266744
- 0 Osborne Hill Rd Unit 280832
- 0 Osborne Hill Rd Unit 79-81 ONEHM312183
- 0 Osborne Hill Rd Unit 375986
- 117 Osborne Hill Rd
- 117 Osborne Hill Rd
- 109 Osborne Hill Rd
- 810 Tavares Ln
- 94 Osborne Hill Rd
- 121 Osborne Hill Rd
- 4 Fleetwood Dr
- 7 Tavares Ln
- 4 Barbara Ln
- 125 Osborne Hill Rd
- 125 Osborne Hill Rd Unit 1
- 3 Fleetwood Dr
- 6 Barbara Ln