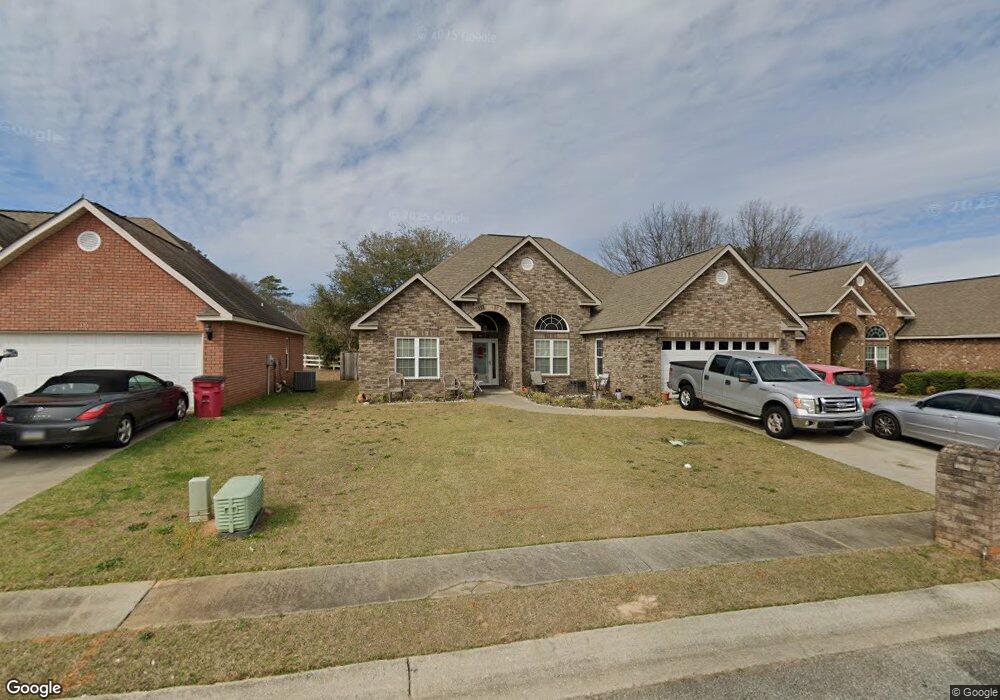
103 Tignor Ct Centerville, GA 31028
Estimated Value: $265,309 - $288,000
3
Beds
2
Baths
1,975
Sq Ft
$140/Sq Ft
Est. Value
About This Home
This home is located at 103 Tignor Ct, Centerville, GA 31028 and is currently estimated at $277,327, approximately $140 per square foot. 103 Tignor Ct is a home located in Houston County with nearby schools including Centerville Elementary School, Thomson Middle School, and Northside High School.
Ownership History
Date
Name
Owned For
Owner Type
Purchase Details
Closed on
Dec 16, 2019
Sold by
Gomez Gabriel B
Bought by
Zanders Betty
Current Estimated Value
Home Financials for this Owner
Home Financials are based on the most recent Mortgage that was taken out on this home.
Original Mortgage
$183,612
Outstanding Balance
$162,197
Interest Rate
3.7%
Mortgage Type
FHA
Estimated Equity
$115,130
Purchase Details
Closed on
Aug 23, 2019
Sold by
Vanvo Peter Van
Bought by
Trudy Ann Gomez Living Trust
Purchase Details
Closed on
Jul 9, 2007
Sold by
Golden Dream Homes Of Warner Robins Inc
Bought by
Vanvanvo Peter Van
Home Financials for this Owner
Home Financials are based on the most recent Mortgage that was taken out on this home.
Original Mortgage
$100,000
Interest Rate
6.37%
Mortgage Type
New Conventional
Create a Home Valuation Report for This Property
The Home Valuation Report is an in-depth analysis detailing your home's value as well as a comparison with similar homes in the area
Home Values in the Area
Average Home Value in this Area
Purchase History
| Date | Buyer | Sale Price | Title Company |
|---|---|---|---|
| Zanders Betty | $187,000 | None Available | |
| Trudy Ann Gomez Living Trust | $187,500 | None Available | |
| Vanvanvo Peter Van | $179,600 | None Available |
Source: Public Records
Mortgage History
| Date | Status | Borrower | Loan Amount |
|---|---|---|---|
| Open | Zanders Betty | $183,612 | |
| Previous Owner | Vanvanvo Peter Van | $100,000 |
Source: Public Records
Tax History
| Year | Tax Paid | Tax Assessment Tax Assessment Total Assessment is a certain percentage of the fair market value that is determined by local assessors to be the total taxable value of land and additions on the property. | Land | Improvement |
|---|---|---|---|---|
| 2024 | $3,157 | $92,320 | $8,000 | $84,320 |
| 2023 | $2,742 | $79,800 | $8,000 | $71,800 |
| 2022 | $1,680 | $75,080 | $8,000 | $67,080 |
| 2021 | $1,487 | $66,320 | $8,000 | $58,320 |
| 2020 | $1,423 | $63,240 | $8,000 | $55,240 |
| 2019 | $1,423 | $63,240 | $8,000 | $55,240 |
| 2018 | $1,423 | $63,240 | $8,000 | $55,240 |
| 2017 | $1,424 | $63,240 | $8,000 | $55,240 |
| 2016 | $1,426 | $63,240 | $8,000 | $55,240 |
| 2015 | $1,429 | $63,240 | $8,000 | $55,240 |
| 2014 | -- | $64,360 | $8,000 | $56,360 |
| 2013 | -- | $64,360 | $8,000 | $56,360 |
Source: Public Records
Map
Nearby Homes
- 214 Mcvey Trail
- 114 Collins Estate Ave
- 200 Collins Estate Ave
- 208 Bassett St
- 105 Parker Ln
- 202 Bassett St
- 102 Lee St Unit 117 Wilson Drive
- 102 Lee St
- 107 Miller Ct
- 110 Lee St
- 117 Crestwood Ct
- 121 Crestwood Rd
- 132 Montrose Ln
- 111 Montrose Ln
- 115 Montrose Ln
- 108 Madison Ave
- 708 N Houston Lake Blvd
- 100 Jamestown Ct
- 108 Weaver Rd
- 110 Wray St
Your Personal Tour Guide
Ask me questions while you tour the home.