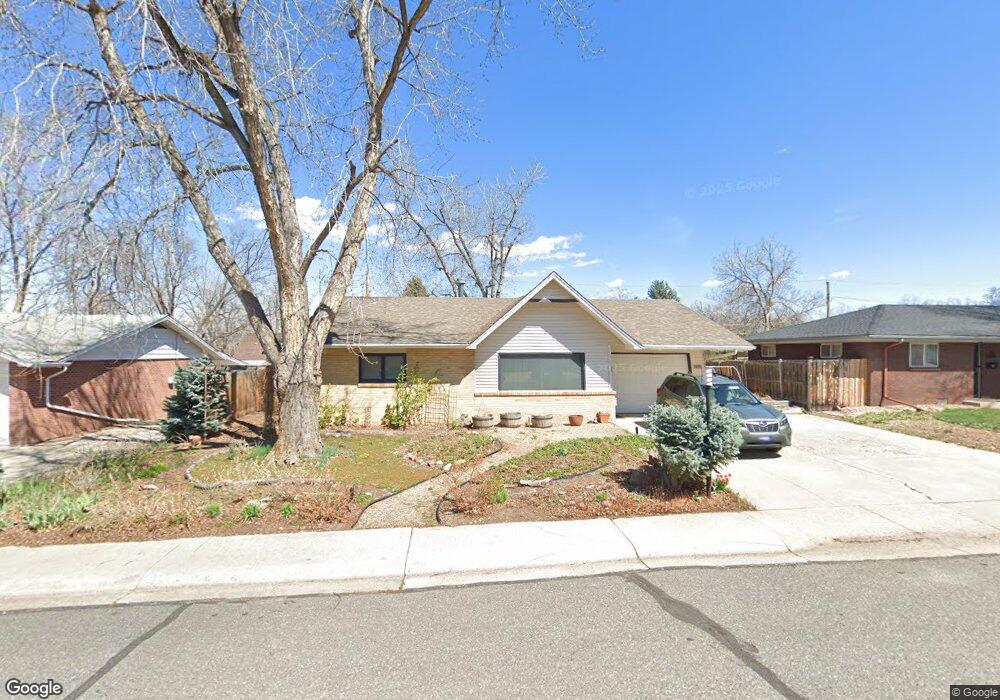
1030 Sumac St Longmont, CO 80501
Loomiller NeighborhoodEstimated Value: $446,936 - $517,000
3
Beds
2
Baths
1,460
Sq Ft
$326/Sq Ft
Est. Value
About This Home
This home is located at 1030 Sumac St, Longmont, CO 80501 and is currently estimated at $475,984, approximately $326 per square foot. 1030 Sumac St is a home located in Boulder County with nearby schools including Mountain View Elementary School, Longs Peak Middle School, and Longmont High School.
Ownership History
Date
Name
Owned For
Owner Type
Purchase Details
Closed on
Apr 28, 2011
Sold by
Hamill Jack E
Bought by
Lombardo Elizabeth A
Current Estimated Value
Home Financials for this Owner
Home Financials are based on the most recent Mortgage that was taken out on this home.
Original Mortgage
$153,200
Outstanding Balance
$106,172
Interest Rate
4.82%
Mortgage Type
New Conventional
Estimated Equity
$369,812
Purchase Details
Closed on
Dec 30, 2004
Sold by
Hamill Jack E and Estate Of Jack E Hamill
Bought by
Hamill Ii Jack E
Purchase Details
Closed on
Jul 17, 2002
Sold by
Hamill Jack E and Estate Of Eleanor Hamill
Bought by
Hamill Jack E
Purchase Details
Closed on
Oct 18, 2000
Sold by
Hamill Jack E and Hamill Eleanor
Bought by
Hamill Jack E
Purchase Details
Closed on
Sep 23, 1992
Bought by
Lombardo Elizabeth A
Create a Home Valuation Report for This Property
The Home Valuation Report is an in-depth analysis detailing your home's value as well as a comparison with similar homes in the area
Home Values in the Area
Average Home Value in this Area
Purchase History
| Date | Buyer | Sale Price | Title Company |
|---|---|---|---|
| Lombardo Elizabeth A | $191,500 | Chicago Title Co | |
| Hamill Ii Jack E | -- | -- | |
| Hamill Jack E | -- | -- | |
| Hamill Jack E | -- | -- | |
| Lombardo Elizabeth A | -- | -- |
Source: Public Records
Mortgage History
| Date | Status | Borrower | Loan Amount |
|---|---|---|---|
| Open | Lombardo Elizabeth A | $153,200 |
Source: Public Records
Tax History
| Year | Tax Paid | Tax Assessment Tax Assessment Total Assessment is a certain percentage of the fair market value that is determined by local assessors to be the total taxable value of land and additions on the property. | Land | Improvement |
|---|---|---|---|---|
| 2025 | $2,481 | $27,113 | $5,694 | $21,419 |
| 2024 | $2,481 | $27,113 | $5,694 | $21,419 |
| 2023 | $2,448 | $25,942 | $6,338 | $23,289 |
| 2022 | $2,193 | $22,156 | $4,663 | $17,493 |
| 2021 | $2,221 | $22,795 | $4,798 | $17,997 |
| 2020 | $1,943 | $19,999 | $4,791 | $15,208 |
| 2019 | $1,912 | $19,999 | $4,791 | $15,208 |
| 2018 | $1,613 | $16,985 | $4,320 | $12,665 |
| 2017 | $1,591 | $18,778 | $4,776 | $14,002 |
| 2016 | $1,420 | $14,853 | $5,094 | $9,759 |
| 2015 | $1,353 | $13,795 | $4,378 | $9,417 |
| 2014 | $1,289 | $13,795 | $4,378 | $9,417 |
Source: Public Records
Map
Nearby Homes
- 1045 Rose St
- 1826 9th Ave
- 925 Hover Ridge Cir Unit 10
- 927 Hover Ridge Cir
- 1239 Sunset St
- 1208 Juniper St
- 1217 Hunter Ct
- 835 Hillside Ct
- 1230 Hover St
- 2335 Brendy Ct
- 6 Sunset Cir
- 850 Judson St
- 819 Widgeon Cir
- 24 Cedar Ct
- 1414 Linden St
- 1444 9th Ave
- 734 Vivian St
- 1434 12th Ave
- 23 Cedar Ct
- 715 Hover St
Your Personal Tour Guide
Ask me questions while you tour the home.