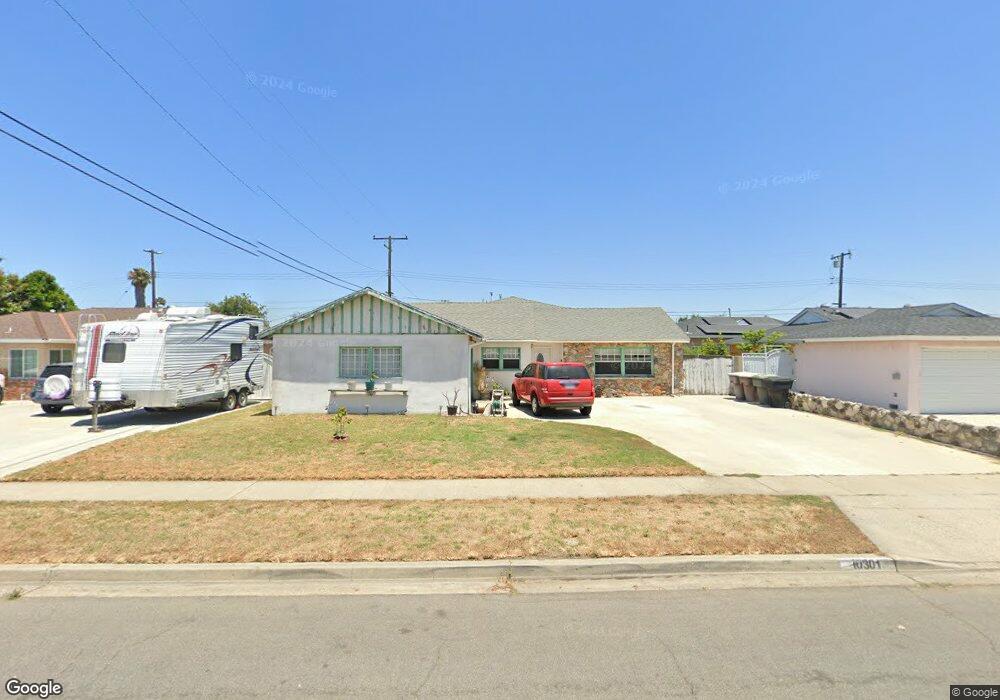
10301 Kern Ave Garden Grove, CA 92843
Little Saigon NeighborhoodEstimated Value: $990,000 - $1,309,380
4
Beds
4
Baths
2,403
Sq Ft
$469/Sq Ft
Est. Value
About This Home
This home is located at 10301 Kern Ave, Garden Grove, CA 92843 and is currently estimated at $1,127,845, approximately $469 per square foot. 10301 Kern Ave is a home located in Orange County with nearby schools including Morningside Elementary School, James Irvine Intermediate School, and Bolsa Grande High School.
Ownership History
Date
Name
Owned For
Owner Type
Purchase Details
Closed on
Mar 29, 2016
Sold by
Ethridge Jamie H and Do Jamie H
Bought by
Ethridge Steven and Ethridge Jamie H
Current Estimated Value
Home Financials for this Owner
Home Financials are based on the most recent Mortgage that was taken out on this home.
Original Mortgage
$250,000
Outstanding Balance
$198,218
Interest Rate
3.62%
Mortgage Type
New Conventional
Estimated Equity
$929,627
Purchase Details
Closed on
Apr 24, 2009
Sold by
Le Thuy H
Bought by
Do Jamie H
Home Financials for this Owner
Home Financials are based on the most recent Mortgage that was taken out on this home.
Original Mortgage
$180,000
Interest Rate
4.99%
Mortgage Type
New Conventional
Purchase Details
Closed on
Apr 22, 1996
Sold by
Stewart David P
Bought by
Le Thuy H and Do Huyen K
Home Financials for this Owner
Home Financials are based on the most recent Mortgage that was taken out on this home.
Original Mortgage
$116,000
Interest Rate
7.96%
Create a Home Valuation Report for This Property
The Home Valuation Report is an in-depth analysis detailing your home's value as well as a comparison with similar homes in the area
Home Values in the Area
Average Home Value in this Area
Purchase History
| Date | Buyer | Sale Price | Title Company |
|---|---|---|---|
| Ethridge Steven | -- | Pacific Coast Title Company | |
| Do Jamie H | -- | Lawyers Title | |
| Le Thuy H | $145,000 | Continental Lawyers Title Co |
Source: Public Records
Mortgage History
| Date | Status | Borrower | Loan Amount |
|---|---|---|---|
| Open | Ethridge Steven | $250,000 | |
| Closed | Do Jamie H | $180,000 | |
| Previous Owner | Le Thuy H | $116,000 |
Source: Public Records
Tax History Compared to Growth
Tax History
| Year | Tax Paid | Tax Assessment Tax Assessment Total Assessment is a certain percentage of the fair market value that is determined by local assessors to be the total taxable value of land and additions on the property. | Land | Improvement |
|---|---|---|---|---|
| 2025 | $4,831 | $381,144 | $168,843 | $212,301 |
| 2024 | $4,831 | $373,671 | $165,532 | $208,139 |
| 2023 | $4,741 | $366,345 | $162,287 | $204,058 |
| 2022 | $4,640 | $359,162 | $159,105 | $200,057 |
| 2021 | $4,591 | $352,120 | $155,985 | $196,135 |
| 2020 | $4,531 | $348,510 | $154,386 | $194,124 |
| 2019 | $4,446 | $341,677 | $151,359 | $190,318 |
| 2018 | $4,358 | $334,978 | $148,391 | $186,587 |
| 2017 | $4,299 | $328,410 | $145,481 | $182,929 |
| 2016 | $3,680 | $286,335 | $142,628 | $143,707 |
| 2015 | $3,643 | $283,283 | $140,485 | $142,798 |
| 2014 | $2,626 | $196,498 | $137,733 | $58,765 |
Source: Public Records
Map
Nearby Homes
- 14171 Flower St
- 9884 11th St
- 14151 Lake St
- 14356 Taft St
- 9906 13th St
- 10061 15th St
- 9936 Pear Dr
- 10886 Lotus Dr
- 5317 Silver Dr
- 5405 W 4th St
- 9851 Bolsa Ave Unit 198
- 9851 Bolsa Ave Unit 196
- 812 N Euclid St
- 13322 Euclid St
- 10632 Henderson Ave
- 14376 Euclid St Unit 1-4
- 14362 Bushard St Unit 39
- 14362 Bushard St Unit 109
- 9800 Bolsa Ave Unit 14
- 323 N Euclid St Unit 99
- 10311 Kern Ave
- 10281 Kern Ave
- 10302 Orrey Place
- 10282 Orrey Place
- 10312 Orrey Place
- 10321 Kern Ave
- 10271 Kern Ave
- 10272 Orrey Place
- 10322 Orrey Place
- 10302 Kern Ave
- 10312 Kern Ave
- 10292 Kern Ave
- 10341 Kern Ave
- 10322 Kern Ave
- 10272 Kern Ave
- 10342 Orrey Place
- 10342 Kern Ave
- 10351 Kern Ave
- 14411 Deanann Place
- 10301 Orrey Place