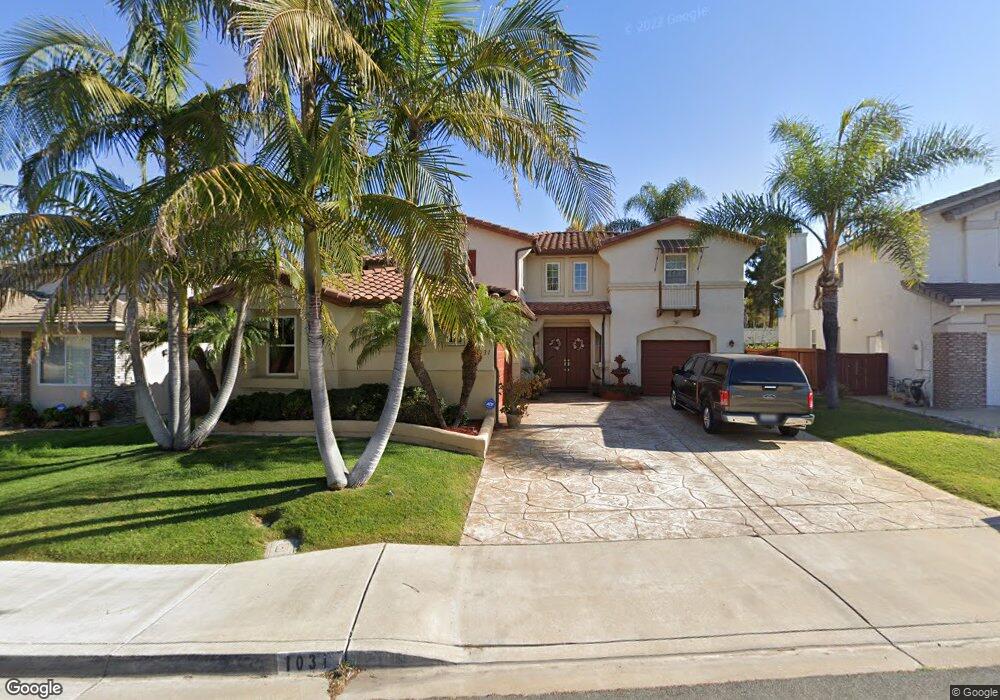
1031 Burga Loop Chula Vista, CA 91910
Rancho Del Rey NeighborhoodEstimated Value: $1,189,000 - $1,712,000
6
Beds
3
Baths
3,481
Sq Ft
$417/Sq Ft
Est. Value
About This Home
This home is located at 1031 Burga Loop, Chula Vista, CA 91910 and is currently estimated at $1,450,380, approximately $416 per square foot. 1031 Burga Loop is a home located in San Diego County with nearby schools including Bonita Vista Middle School, Bonita Vista Senior High School, and Discovery Charter School.
Ownership History
Date
Name
Owned For
Owner Type
Purchase Details
Closed on
May 11, 2019
Sold by
Tolley John Charles and Tolley Sheryl Ann
Bought by
The Tolley Family Trust
Current Estimated Value
Purchase Details
Closed on
Apr 4, 2017
Sold by
Roach Douglas A and Roach Della M
Bought by
Tolley John Charles and Tolley Sheryl Ann
Purchase Details
Closed on
Nov 6, 2013
Sold by
La Jolla Finance Corporation
Bought by
Roach Douglas A and Roach Della M
Home Financials for this Owner
Home Financials are based on the most recent Mortgage that was taken out on this home.
Original Mortgage
$640,000
Interest Rate
4.62%
Mortgage Type
Adjustable Rate Mortgage/ARM
Purchase Details
Closed on
Jun 5, 2013
Sold by
Sayd Carlos and Sayd Linda
Bought by
La Jolla Finance Corporation
Purchase Details
Closed on
Oct 28, 1998
Sold by
Rdr 2115 Llc
Bought by
Sayd Carols and Sayd Linda
Home Financials for this Owner
Home Financials are based on the most recent Mortgage that was taken out on this home.
Original Mortgage
$283,819
Interest Rate
6.5%
Create a Home Valuation Report for This Property
The Home Valuation Report is an in-depth analysis detailing your home's value as well as a comparison with similar homes in the area
Home Values in the Area
Average Home Value in this Area
Purchase History
| Date | Buyer | Sale Price | Title Company |
|---|---|---|---|
| The Tolley Family Trust | -- | None Available | |
| Tolley John Charles | $777,000 | Fidelity Natl Title Sd Co | |
| Roach Douglas A | $640,000 | Fidelity National Title Co | |
| La Jolla Finance Corporation | $525,000 | Chicago Title Company | |
| Sayd Carols | $355,500 | First American Title |
Source: Public Records
Mortgage History
| Date | Status | Borrower | Loan Amount |
|---|---|---|---|
| Previous Owner | Roach Douglas A | $640,000 | |
| Previous Owner | Sayd Carols | $283,819 |
Source: Public Records
Tax History
| Year | Tax Paid | Tax Assessment Tax Assessment Total Assessment is a certain percentage of the fair market value that is determined by local assessors to be the total taxable value of land and additions on the property. | Land | Improvement |
|---|---|---|---|---|
| 2025 | $10,591 | $901,766 | $253,727 | $648,039 |
| 2024 | $10,591 | $884,085 | $248,752 | $635,333 |
| 2023 | $12,717 | $866,751 | $243,875 | $622,876 |
| 2022 | $12,304 | $849,757 | $239,094 | $610,663 |
| 2021 | $12,014 | $833,096 | $234,406 | $598,690 |
| 2020 | $11,723 | $824,555 | $232,003 | $592,552 |
| 2019 | $11,419 | $808,388 | $227,454 | $580,934 |
| 2018 | $11,211 | $792,539 | $222,995 | $569,544 |
| 2017 | $9,987 | $675,994 | $190,203 | $485,791 |
| 2016 | $9,702 | $662,740 | $186,474 | $476,266 |
| 2015 | $9,546 | $652,786 | $183,673 | $469,113 |
| 2014 | $9,350 | $640,000 | $180,076 | $459,924 |
Source: Public Records
Map
Nearby Homes
- 1006 Acero St
- 454 Acero Place
- 512 Bayona Loop
- 408 Milagrosa Cir
- 363 Surrey Dr
- 454 Camino Elevado
- 308 Maverick Place
- 0 0 Unit 62
- 1349 Ridgeview Way
- 4020 Tim St
- 919 Caminito Estrella
- 1365 Callejon Cervantes Unit 135
- 575 Otay Lakes Rd Unit 43
- 1386 Serena Cir Unit 1
- 856 Misty Meadow Ct
- 1430 Country Vistas Ln
- 1415 Summit Dr
- 4201 Bonita Rd Unit 243
- 4201 Bonita Rd Unit 135
- 4201 Bonita Rd Unit 242
- 1033 Burga Loop
- 1029 Burga Loop
- 1035 Burga Loop
- 1022 Burga Loop
- 1027 Burga Loop
- 507 Paseo Burga
- 1020 Burga Loop
- 1025 Burga Loop
- 1038 Abeto Ct
- 1044 Abeto Ct
- 511 Paseo Burga
- 1023 Burga Loop
- 999 Palencia Ct Unit 2
- 1050 Abeto Ct
- 1018 Burga Loop
- 1021 Burga Loop
- 515 Paseo Burga
- 500 Paseo Rosal
- 996 Palencia Ct
- 504 Paseo Rosal
Your Personal Tour Guide
Ask me questions while you tour the home.