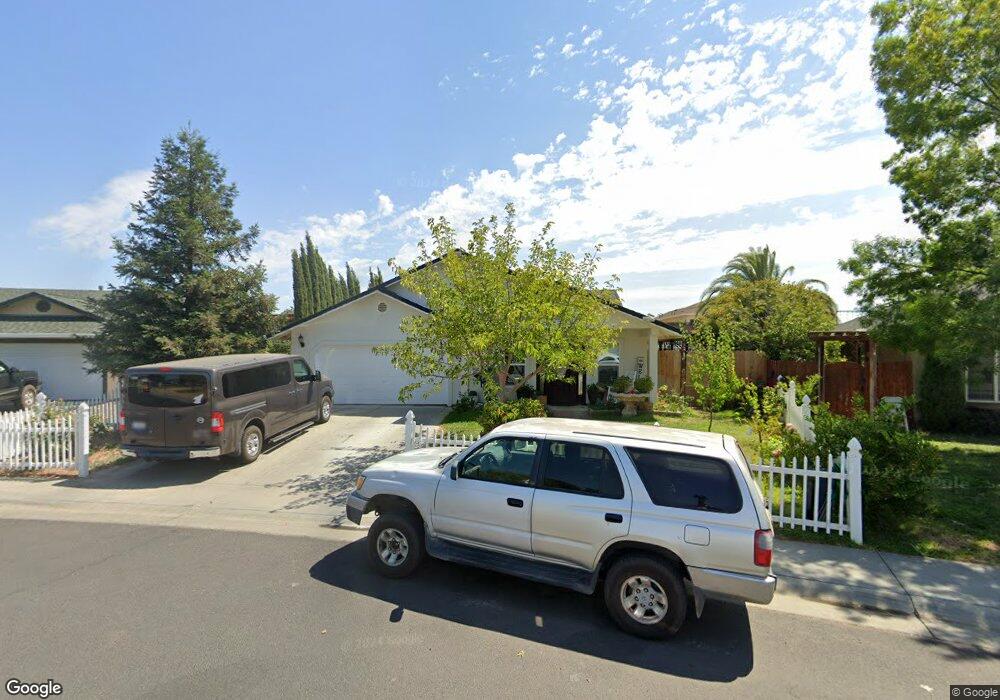
1031 McDonald Ct Corning, CA 96021
Estimated Value: $327,000 - $399,000
5
Beds
3
Baths
1,350
Sq Ft
$265/Sq Ft
Est. Value
About This Home
This home is located at 1031 McDonald Ct, Corning, CA 96021 and is currently estimated at $357,087, approximately $264 per square foot. 1031 McDonald Ct is a home located in Tehama County with nearby schools including Olive View Elementary School, Maywood Middle School, and Corning High School.
Ownership History
Date
Name
Owned For
Owner Type
Purchase Details
Closed on
Oct 20, 2005
Sold by
Self Help Home Improvement Project
Bought by
Gonzalez Jose M and Gonzalez Maria O
Current Estimated Value
Home Financials for this Owner
Home Financials are based on the most recent Mortgage that was taken out on this home.
Original Mortgage
$12,000
Outstanding Balance
$6,519
Interest Rate
5.9%
Mortgage Type
Unknown
Estimated Equity
$350,568
Purchase Details
Closed on
Dec 20, 2004
Sold by
Amen Grant and Amen June
Bought by
Self Help Home Improvement Project
Create a Home Valuation Report for This Property
The Home Valuation Report is an in-depth analysis detailing your home's value as well as a comparison with similar homes in the area
Purchase History
| Date | Buyer | Sale Price | Title Company |
|---|---|---|---|
| Gonzalez Jose M | $45,000 | Chicago Title Co | |
| Self Help Home Improvement Project | $84,000 | Chicago Title Co |
Source: Public Records
Mortgage History
| Date | Status | Borrower | Loan Amount |
|---|---|---|---|
| Open | Gonzalez Jose M | $12,000 | |
| Open | Gonzalez Jose M | $123,000 |
Source: Public Records
Tax History
| Year | Tax Paid | Tax Assessment Tax Assessment Total Assessment is a certain percentage of the fair market value that is determined by local assessors to be the total taxable value of land and additions on the property. | Land | Improvement |
|---|---|---|---|---|
| 2025 | $2,868 | $279,781 | $64,951 | $214,830 |
| 2023 | $2,345 | $229,781 | $64,951 | $164,830 |
| 2022 | $2,358 | $229,781 | $64,951 | $164,830 |
| 2021 | $2,099 | $208,891 | $59,046 | $149,845 |
| 2020 | $1,855 | $181,644 | $51,344 | $130,300 |
| 2019 | $1,725 | $172,994 | $48,899 | $124,095 |
| 2018 | $1,596 | $157,268 | $44,454 | $112,814 |
| 2017 | $1,463 | $142,971 | $40,413 | $102,558 |
| 2016 | $1,322 | $136,163 | $38,489 | $97,674 |
| 2015 | $1,335 | $136,163 | $38,489 | $97,674 |
| 2014 | $1,154 | $118,403 | $33,469 | $84,934 |
Source: Public Records
Map
Nearby Homes
- 1035 McDonald Ct
- 1027 McDonald Ct
- 936 Snow Peak St
- 1055 McDonald Ct
- 1017 McDonald Ct
- 1030 McDonald Ct
- 916 Snow Peak St
- 1013 McDonald Ct
- 1020 McDonald Ct
- 1085 McDonald Ct
- 1111 McDonald Ct
- 1005 McDonald Ct
- 931 Snow Peak St
- 951 Snow Peak St
- 230 Taylor Ct
- 365 Clear Creek St
- 1102 McDonald Ct
- 1006 McDonald Ct
- 1155 McDonald Ct
- 976 Snow Peak St