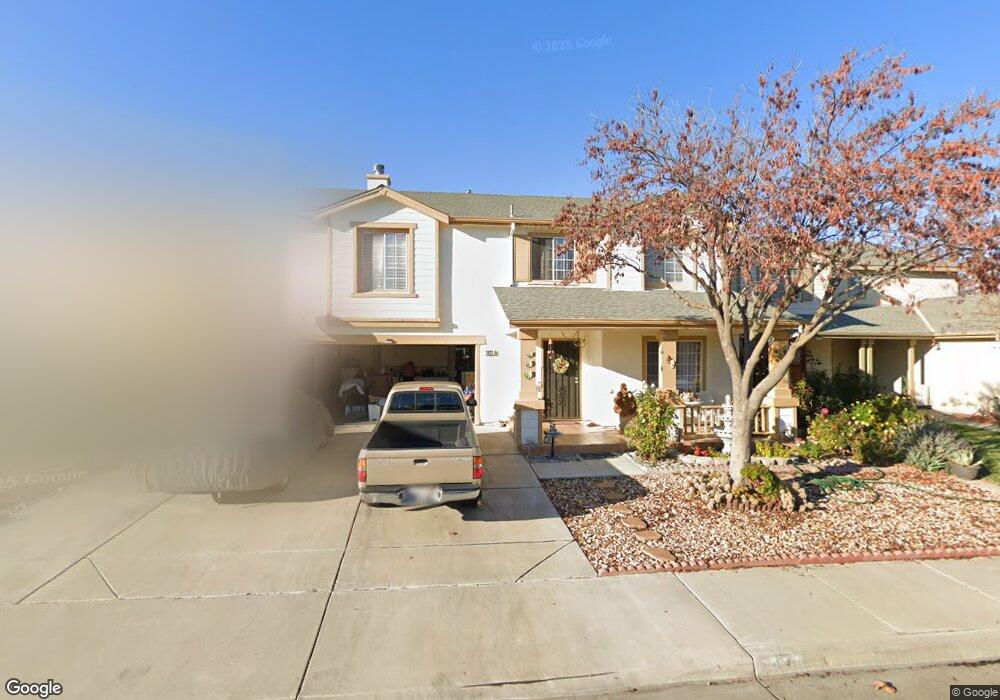
1031 Sparrow Hawk Ln Patterson, CA 95363
Estimated Value: $465,000 - $519,906
4
Beds
3
Baths
2,377
Sq Ft
$209/Sq Ft
Est. Value
About This Home
This home is located at 1031 Sparrow Hawk Ln, Patterson, CA 95363 and is currently estimated at $495,977, approximately $208 per square foot. 1031 Sparrow Hawk Ln is a home located in Stanislaus County with nearby schools including Northmead Elementary School, Creekside Middle School, and Patterson High School.
Ownership History
Date
Name
Owned For
Owner Type
Purchase Details
Closed on
Oct 12, 2011
Sold by
Shah Abdul Samad and Shah Tahira Bibi
Bought by
Shah Abdul Samad and Shah Tahira Bibi
Current Estimated Value
Purchase Details
Closed on
Jan 22, 2003
Sold by
Bibi Shek A
Bought by
Shah Abdul Samab and Shah Tahira Bibi
Home Financials for this Owner
Home Financials are based on the most recent Mortgage that was taken out on this home.
Original Mortgage
$139,600
Outstanding Balance
$58,730
Interest Rate
5.83%
Estimated Equity
$437,247
Purchase Details
Closed on
Aug 5, 1998
Sold by
Kaufman & Broad Central Valley Inc
Bought by
Shah Abdul Samab and Shah Tahira Bibi
Home Financials for this Owner
Home Financials are based on the most recent Mortgage that was taken out on this home.
Original Mortgage
$140,235
Interest Rate
6.95%
Mortgage Type
FHA
Create a Home Valuation Report for This Property
The Home Valuation Report is an in-depth analysis detailing your home's value as well as a comparison with similar homes in the area
Home Values in the Area
Average Home Value in this Area
Purchase History
| Date | Buyer | Sale Price | Title Company |
|---|---|---|---|
| Shah Abdul Samad | -- | None Available | |
| Shah Abdul Samab | -- | Alliance Title Company | |
| Shah Abdul Samab | $157,000 | First American Title Ins Co | |
| Bibi Shek A | -- | First American Title Ins Co |
Source: Public Records
Mortgage History
| Date | Status | Borrower | Loan Amount |
|---|---|---|---|
| Open | Shah Abdul Samab | $139,600 | |
| Previous Owner | Shah Abdul Samab | $140,235 |
Source: Public Records
Tax History
| Year | Tax Paid | Tax Assessment Tax Assessment Total Assessment is a certain percentage of the fair market value that is determined by local assessors to be the total taxable value of land and additions on the property. | Land | Improvement |
|---|---|---|---|---|
| 2025 | $3,376 | $269,107 | $39,184 | $229,923 |
| 2024 | $3,361 | $263,831 | $38,416 | $225,415 |
| 2023 | $3,286 | $258,659 | $37,663 | $220,996 |
| 2022 | $3,727 | $253,588 | $36,925 | $216,663 |
| 2021 | $3,676 | $248,616 | $36,201 | $212,415 |
| 2020 | $3,672 | $246,067 | $35,830 | $210,237 |
| 2019 | $3,620 | $241,243 | $35,128 | $206,115 |
| 2018 | $3,479 | $236,514 | $34,440 | $202,074 |
| 2017 | $3,409 | $231,877 | $33,765 | $198,112 |
| 2016 | $3,323 | $227,331 | $33,103 | $194,228 |
| 2015 | $3,306 | $223,917 | $32,606 | $191,311 |
| 2014 | $3,227 | $219,532 | $31,968 | $187,564 |
Source: Public Records
Map
Nearby Homes
- 409 Osprey Dr
- 642 Wanzia Ct
- 647 Ward Ave
- 433 Sanderling Dr
- 216 Barros St
- 1127 Kestrel Dr
- 445 M St
- 1314 Sutter Creek Ct
- 1132 Marsh Wren Ct
- 432 Meadow Creek Dr
- 701 N 3rd St
- 15707 S 9th St
- 855 Toyon Ln
- 849 Miraggio Dr
- 140 Ivy Ave Unit A5
- 140 Ivy Ave Unit 39
- 147 Ivy Ave
- 1407 Dylan Creek Dr
- 1419 Nubian St
- 158 Charbray Ct
- 1027 Sparrow Hawk Ln
- 1035 Sparrow Hawk Ln
- 1032 Goldfinch Ln
- 1023 Sparrow Hawk Ln
- 1036 Goldfinch Ln
- 1028 Goldfinch Ln
- 1024 Goldfinch Ln
- 1030 Sparrow Hawk Ln
- 1026 Sparrow Hawk Ln
- 1034 Sparrow Hawk Ln
- 1022 Sparrow Hawk Ln
- 1020 Goldfinch Ln
- 431 Thrush Dr
- 435 Thrush Dr
- 427 Thrush Dr
- 439 Thrush Dr
- 1015 Sparrow Hawk Ln
- 1018 Sparrow Hawk Ln
- 423 Thrush Dr
- 1016 Goldfinch Ln
Your Personal Tour Guide
Ask me questions while you tour the home.