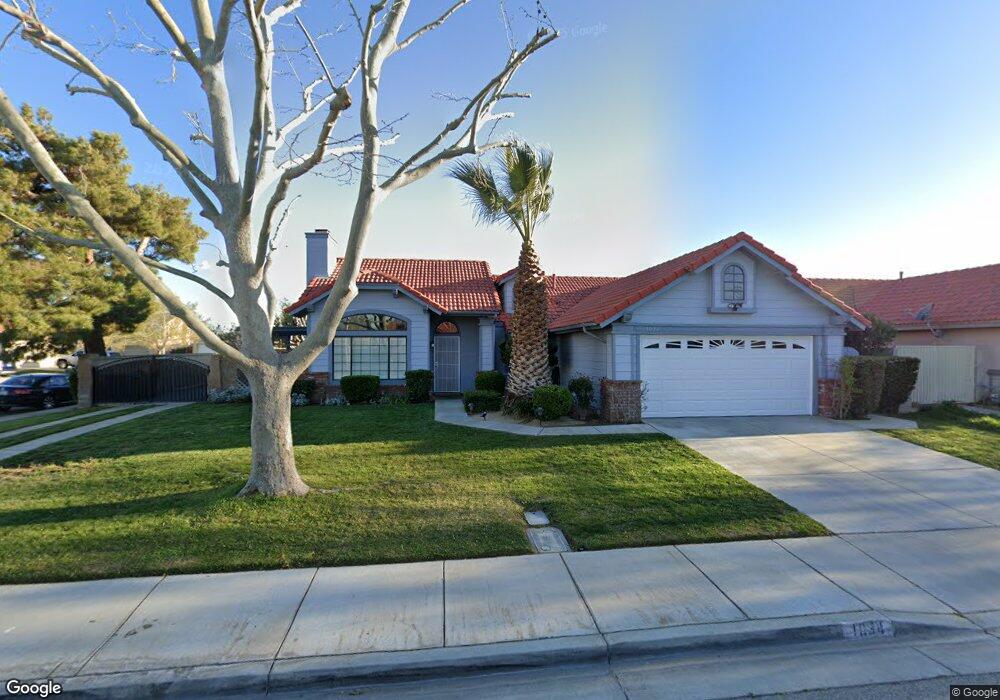
1034 James Ct Lancaster, CA 93535
East Lancaster NeighborhoodEstimated Value: $424,080 - $467,000
3
Beds
2
Baths
1,539
Sq Ft
$292/Sq Ft
Est. Value
About This Home
This home is located at 1034 James Ct, Lancaster, CA 93535 and is currently estimated at $449,020, approximately $291 per square foot. 1034 James Ct is a home located in Los Angeles County with nearby schools including Jack Northrop Elementary School, New Vista Middle School, and Eastside High School.
Ownership History
Date
Name
Owned For
Owner Type
Purchase Details
Closed on
Aug 4, 2018
Sold by
Pascascio Rosita
Bought by
Pascascio Rosita and The Rosita Pascascio Revocable Trust
Current Estimated Value
Purchase Details
Closed on
Oct 27, 2010
Sold by
Johnson Rose Sokol
Bought by
Pascascio Rosita
Home Financials for this Owner
Home Financials are based on the most recent Mortgage that was taken out on this home.
Original Mortgage
$112,500
Outstanding Balance
$73,809
Interest Rate
4.16%
Mortgage Type
New Conventional
Estimated Equity
$375,211
Purchase Details
Closed on
Jul 5, 2007
Sold by
Johnson Rose Sokol
Bought by
Johnson Rose Sokol and Wilfred Clement & Rose Sokol Johnson Fam
Purchase Details
Closed on
Jul 1, 1998
Sold by
Johnson Wilfred C
Bought by
Johnson Wilfred Clement and Johnson Rose Sokol
Purchase Details
Closed on
Oct 17, 1995
Sold by
Lawler Edwin
Bought by
Johnson Wilfred C and Johnson Rose Sokol
Create a Home Valuation Report for This Property
The Home Valuation Report is an in-depth analysis detailing your home's value as well as a comparison with similar homes in the area
Home Values in the Area
Average Home Value in this Area
Purchase History
| Date | Buyer | Sale Price | Title Company |
|---|---|---|---|
| Pascascio Rosita | -- | None Available | |
| Pascascio Rosita | $125,000 | Chicago Title Company | |
| Johnson Rose Sokol | -- | None Available | |
| Johnson Wilfred Clement | -- | -- | |
| Johnson Wilfred C | $100,000 | Chicago Title Co |
Source: Public Records
Mortgage History
| Date | Status | Borrower | Loan Amount |
|---|---|---|---|
| Open | Pascascio Rosita | $112,500 |
Source: Public Records
Tax History
| Year | Tax Paid | Tax Assessment Tax Assessment Total Assessment is a certain percentage of the fair market value that is determined by local assessors to be the total taxable value of land and additions on the property. | Land | Improvement |
|---|---|---|---|---|
| 2025 | $3,354 | $160,133 | $32,023 | $128,110 |
| 2024 | $3,354 | $156,995 | $31,396 | $125,599 |
| 2023 | $3,288 | $153,918 | $30,781 | $123,137 |
| 2022 | $3,101 | $150,901 | $30,178 | $120,723 |
| 2021 | $2,717 | $147,943 | $29,587 | $118,356 |
| 2019 | $2,648 | $143,557 | $28,710 | $114,847 |
| 2018 | $2,604 | $140,744 | $28,148 | $112,596 |
| 2016 | $2,806 | $135,281 | $27,056 | $108,225 |
| 2015 | $2,778 | $133,250 | $26,650 | $106,600 |
| 2014 | $2,773 | $130,640 | $26,128 | $104,512 |
Source: Public Records
Map
Nearby Homes
- 1021 Brianna Ave
- 23000 E Avenue k12 Unit Vic
- 43010 Yaffa St
- 0 Challenger Wy Vic Ave Unit L 25006032
- 0 Way
- 751 Pino Ave
- 43120 7th St E
- 43029 7th St E
- 4 Melody Ln
- 43341 Elizabeth Ln
- 729 Whitlatch Dr
- 700 E Vac Ave L Vic 7th Ste
- 0 Ave L and 6th St E Unit 25008965
- 0 Ave L-4 East of Challenger Way Unit 25008964
- 43415 Emilia Ln
- 0 Unit 25008816
- 637 E Avenue k4
- 43433 7th St E
- 1118 E Avenue K
- 43453 7th St E
- 1026 James Ct
- 1035 E Avenue k11
- 1029 E Avenue k11
- 1023 E Avenue k11
- 1035 James Ct
- 43032 11th St E
- 1018 James Ct
- 43030 11th St E
- 1027 James Ct
- 43038 11th St E
- 43022 11th St E
- 1019 E Avenue k11
- 43044 11th St E
- 1019 James Ct
- 1010 James Ct
- 1034 E Avenue k11
- 1036 Brianna Ave
- 1040 E Avenue k11
- 1028 Brianna Ave
- 1026 E Avenue k11
Your Personal Tour Guide
Ask me questions while you tour the home.