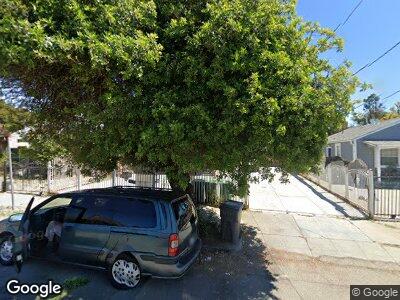
1036 73rd Ave Oakland, CA 94621
Coliseum NeighborhoodEstimated Value: $495,698 - $528,000
4
Beds
3
Baths
1,665
Sq Ft
$307/Sq Ft
Est. Value
About This Home
This home is located at 1036 73rd Ave, Oakland, CA 94621 and is currently estimated at $511,849, approximately $307 per square foot. 1036 73rd Ave is a home located in Alameda County with nearby schools including Futures & CUES at Lockwood, Greenleaf Elementary School, and Coliseum College Prep Academy.
Ownership History
Date
Name
Owned For
Owner Type
Purchase Details
Closed on
Sep 8, 2013
Sold by
Lum Kenneth and Li Su Ping
Bought by
Lum Kenneth
Current Estimated Value
Purchase Details
Closed on
May 25, 2012
Sold by
Rong Zao Xin
Bought by
Lum Kenneth and Li Su Ping
Home Financials for this Owner
Home Financials are based on the most recent Mortgage that was taken out on this home.
Original Mortgage
$83,000
Outstanding Balance
$61,528
Interest Rate
5%
Mortgage Type
Commercial
Estimated Equity
$426,269
Purchase Details
Closed on
Jun 23, 2011
Sold by
Community Fund Llc
Bought by
Rong Zao Xin
Purchase Details
Closed on
Jun 22, 2011
Sold by
Ye Xiao Lin
Bought by
Rong Zao Xin
Purchase Details
Closed on
Aug 31, 2010
Sold by
Wilson Diana
Bought by
Community Fund Llc
Purchase Details
Closed on
Nov 19, 1999
Sold by
Richardson Roosevelt
Bought by
Kidd Annie and Wilson Diana
Home Financials for this Owner
Home Financials are based on the most recent Mortgage that was taken out on this home.
Original Mortgage
$50,000
Interest Rate
7.72%
Mortgage Type
Commercial
Create a Home Valuation Report for This Property
The Home Valuation Report is an in-depth analysis detailing your home's value as well as a comparison with similar homes in the area
Home Values in the Area
Average Home Value in this Area
Purchase History
| Date | Buyer | Sale Price | Title Company |
|---|---|---|---|
| Lum Kenneth | -- | None Available | |
| Lum Kenneth | $168,000 | Old Republic Title Company | |
| Rong Zao Xin | $116,000 | Old Republic Title Company C | |
| Rong Zao Xin | -- | Old Republic Title Company C | |
| Community Fund Llc | $90,000 | None Available | |
| Kidd Annie | $47,000 | Placer Title Company |
Source: Public Records
Mortgage History
| Date | Status | Borrower | Loan Amount |
|---|---|---|---|
| Open | Lum Kenneth | $83,000 | |
| Previous Owner | Wilson Diana | $210,000 | |
| Previous Owner | Wilson Diana | $100,000 | |
| Previous Owner | Kidd Annie | $50,000 |
Source: Public Records
Tax History Compared to Growth
Tax History
| Year | Tax Paid | Tax Assessment Tax Assessment Total Assessment is a certain percentage of the fair market value that is determined by local assessors to be the total taxable value of land and additions on the property. | Land | Improvement |
|---|---|---|---|---|
| 2024 | $5,793 | $206,870 | $62,061 | $144,809 |
| 2023 | $5,826 | $202,814 | $60,844 | $141,970 |
| 2022 | $5,455 | $198,837 | $59,651 | $139,186 |
| 2021 | $4,881 | $194,940 | $58,482 | $136,458 |
| 2020 | $4,441 | $192,942 | $57,882 | $135,060 |
| 2019 | $4,153 | $189,160 | $56,748 | $132,412 |
| 2018 | $4,060 | $185,453 | $55,636 | $129,817 |
| 2017 | $3,856 | $181,817 | $54,545 | $127,272 |
| 2016 | $3,661 | $178,252 | $53,475 | $124,777 |
| 2015 | $3,624 | $175,576 | $52,673 | $122,903 |
| 2014 | $3,703 | $172,137 | $51,641 | $120,496 |
Source: Public Records
Map
Nearby Homes
- 7310 Spencer St
- 1035 76th Ave
- 1102 75th Ave
- 952 72nd Ave
- 950 72nd Ave
- 1069 71st Ave
- 950 71st Ave
- 1143 72nd Ave
- 1180 73rd Ave
- 7115 Herbert Guice Way
- 7510 Rudsdale St
- 920 69th Ave
- 1020 70th Ave
- 1305 76th Ave
- 1257 79th Ave
- 5542 International Blvd
- 1320 76th Ave
- 1423 73rd Ave
- 6601 Eastlawn St
- 1475 70th Ave