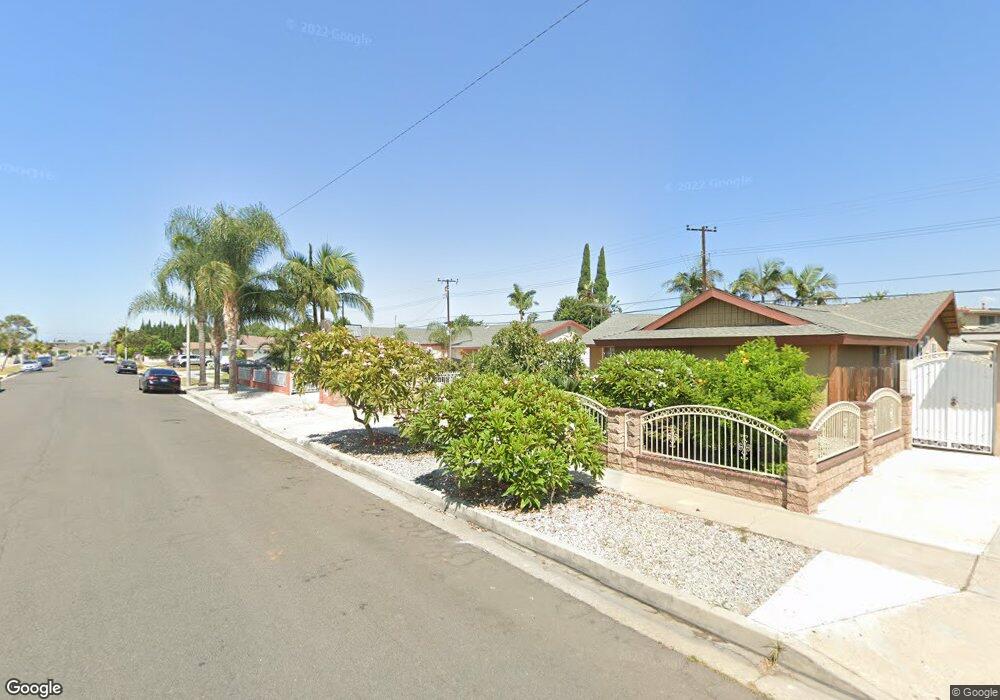
10371 Mast Ave Westminster, CA 92683
Little Saigon NeighborhoodEstimated Value: $904,000 - $942,728
3
Beds
2
Baths
1,204
Sq Ft
$769/Sq Ft
Est. Value
About This Home
This home is located at 10371 Mast Ave, Westminster, CA 92683 and is currently estimated at $926,432, approximately $769 per square foot. 10371 Mast Ave is a home located in Orange County with nearby schools including Post Elementary, James Irvine Intermediate School, and La Quinta High School.
Ownership History
Date
Name
Owned For
Owner Type
Purchase Details
Closed on
Sep 6, 2003
Sold by
Little Van Le and Le Van Thanh
Bought by
Little James Patrick and Little Van Le
Current Estimated Value
Home Financials for this Owner
Home Financials are based on the most recent Mortgage that was taken out on this home.
Original Mortgage
$274,500
Outstanding Balance
$107,424
Interest Rate
3.99%
Mortgage Type
Purchase Money Mortgage
Estimated Equity
$819,008
Purchase Details
Closed on
Jun 30, 2000
Sold by
Michael Vu and Michael Phuong Jeannette
Bought by
Le Van Thanh
Home Financials for this Owner
Home Financials are based on the most recent Mortgage that was taken out on this home.
Original Mortgage
$166,800
Interest Rate
8.63%
Purchase Details
Closed on
Dec 27, 1993
Sold by
Vu Michael and Tran Jeannette Phuong Nguyen
Bought by
Vu Michael T and Tran Jeannette P
Purchase Details
Closed on
Feb 14, 1993
Sold by
Tran Nancy Mailan
Bought by
Vu Micheal and Tran Jeannette Phuong Nguyen
Create a Home Valuation Report for This Property
The Home Valuation Report is an in-depth analysis detailing your home's value as well as a comparison with similar homes in the area
Home Values in the Area
Average Home Value in this Area
Purchase History
| Date | Buyer | Sale Price | Title Company |
|---|---|---|---|
| Little James Patrick | -- | Fidelity National Financial | |
| Le Van Thanh | $208,500 | Fidelity National Title Ins | |
| Vu Michael T | -- | -- | |
| Vu Micheal | -- | Benefit Land Title Co |
Source: Public Records
Mortgage History
| Date | Status | Borrower | Loan Amount |
|---|---|---|---|
| Open | Little James Patrick | $274,500 | |
| Closed | Le Van Thanh | $166,800 | |
| Closed | Little James Patrick | $54,534 |
Source: Public Records
Tax History Compared to Growth
Tax History
| Year | Tax Paid | Tax Assessment Tax Assessment Total Assessment is a certain percentage of the fair market value that is determined by local assessors to be the total taxable value of land and additions on the property. | Land | Improvement |
|---|---|---|---|---|
| 2025 | $4,185 | $324,399 | $242,795 | $81,604 |
| 2024 | $4,185 | $318,039 | $238,035 | $80,004 |
| 2023 | $4,102 | $311,803 | $233,367 | $78,436 |
| 2022 | $4,011 | $305,690 | $228,791 | $76,899 |
| 2021 | $3,950 | $299,697 | $224,305 | $75,392 |
| 2020 | $3,900 | $296,624 | $222,005 | $74,619 |
| 2019 | $3,832 | $290,808 | $217,652 | $73,156 |
| 2018 | $3,762 | $285,106 | $213,384 | $71,722 |
| 2017 | $3,715 | $279,516 | $209,200 | $70,316 |
| 2016 | $3,568 | $274,036 | $205,098 | $68,938 |
| 2015 | $3,522 | $269,920 | $202,017 | $67,903 |
| 2014 | $3,442 | $264,633 | $198,060 | $66,573 |
Source: Public Records
Map
Nearby Homes
- 9936 Pear Dr
- 10632 Henderson Ave
- 14356 Taft St
- 5405 W 4th St
- 5317 Silver Dr
- 9884 11th St
- 10886 Lotus Dr
- 9851 Bolsa Ave Unit 198
- 9851 Bolsa Ave Unit 196
- 14171 Flower St
- 9906 13th St
- 14151 Lake St
- 10061 15th St
- 812 N Euclid St
- 10581 Davit Ave
- 13322 Euclid St
- 9800 Bolsa Ave Unit 14
- 10562 Davit Ave
- 14376 Euclid St Unit 1-4
- 323 N Euclid St Unit 99
- 10361 Mast Ave
- 10381 Mast Ave
- 10352 Arundel Ave
- 10342 Arundel Ave
- 10351 Mast Ave
- 10391 Mast Ave
- 14722 Kensington Ln
- 10332 Arundel Ave
- 10362 Mast Ave
- 10372 Mast Ave
- 10401 Mast Ave
- 10341 Mast Ave
- 10352 Mast Ave
- 10382 Mast Ave
- 10322 Arundel Ave
- 10342 Mast Ave
- 14712 Kensington Ln
- 10392 Mast Ave
- 10331 Mast Ave
- 10411 Mast Ave