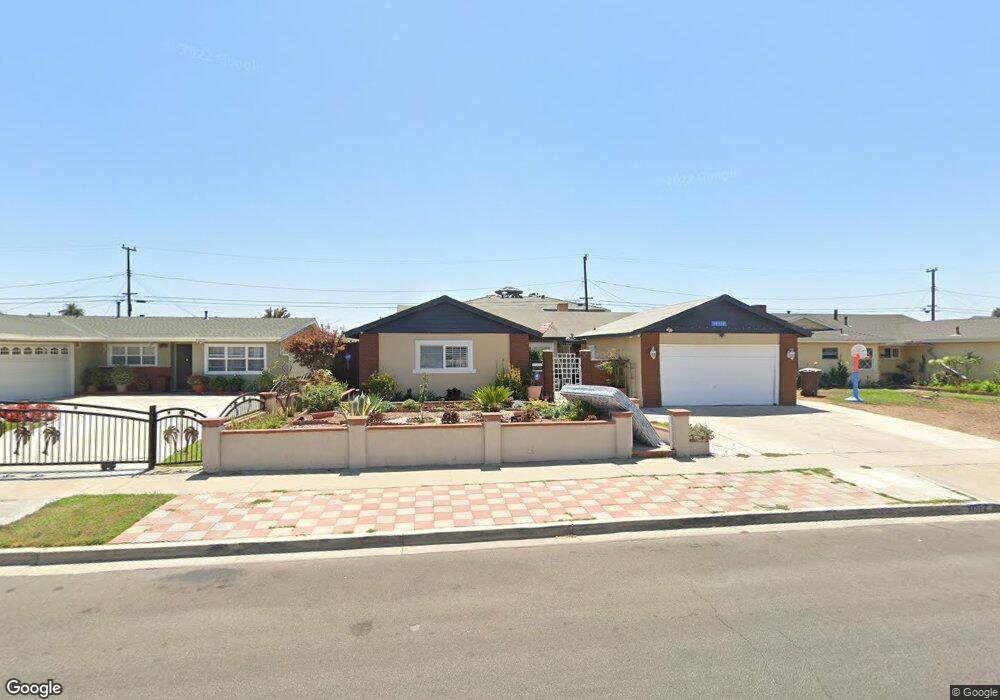
10372 Jennrich Ave Garden Grove, CA 92843
Little Saigon NeighborhoodEstimated Value: $1,087,000 - $1,210,923
3
Beds
2
Baths
1,965
Sq Ft
$578/Sq Ft
Est. Value
About This Home
This home is located at 10372 Jennrich Ave, Garden Grove, CA 92843 and is currently estimated at $1,134,981, approximately $577 per square foot. 10372 Jennrich Ave is a home located in Orange County with nearby schools including Morningside Elementary School, James Irvine Intermediate School, and Bolsa Grande High School.
Ownership History
Date
Name
Owned For
Owner Type
Purchase Details
Closed on
Nov 15, 2021
Sold by
Hoang Vu P and Hoang Raymond Vu
Bought by
Hoang Raymond Vu and Hoang Raymond Vu
Current Estimated Value
Purchase Details
Closed on
Nov 3, 2021
Sold by
Tran Chi H and Hoang Phuong X
Bought by
Hoang Vu P and Hoang Raymond Vu
Purchase Details
Closed on
Jan 14, 1999
Sold by
Ta Uyen T
Bought by
Hoang Hung P
Purchase Details
Closed on
Dec 30, 1998
Sold by
Chi Tran and Chi Phuong Hoang
Bought by
Tran Chi H and Hoang Phuong X
Purchase Details
Closed on
Sep 1, 1995
Sold by
Pipich Ivan T and Pipich Bernice A
Bought by
Tran Chi H and Hoang Phuong X
Home Financials for this Owner
Home Financials are based on the most recent Mortgage that was taken out on this home.
Original Mortgage
$140,000
Interest Rate
7.97%
Create a Home Valuation Report for This Property
The Home Valuation Report is an in-depth analysis detailing your home's value as well as a comparison with similar homes in the area
Home Values in the Area
Average Home Value in this Area
Purchase History
| Date | Buyer | Sale Price | Title Company |
|---|---|---|---|
| Hoang Raymond Vu | -- | None Available | |
| Hoang Vu P | -- | Accommodation/Courtesy Recordi | |
| Hoang Hung P | -- | -- | |
| Tran Chi H | -- | -- | |
| Tran Chi H | $175,000 | Gateway Title Company |
Source: Public Records
Mortgage History
| Date | Status | Borrower | Loan Amount |
|---|---|---|---|
| Previous Owner | Tran Chi H | $140,000 | |
| Closed | Tran Chi H | $17,500 |
Source: Public Records
Tax History Compared to Growth
Tax History
| Year | Tax Paid | Tax Assessment Tax Assessment Total Assessment is a certain percentage of the fair market value that is determined by local assessors to be the total taxable value of land and additions on the property. | Land | Improvement |
|---|---|---|---|---|
| 2025 | $11,063 | $928,557 | $836,801 | $91,756 |
| 2024 | $11,063 | $910,350 | $820,393 | $89,957 |
| 2023 | $10,863 | $892,500 | $804,306 | $88,194 |
| 2022 | $10,716 | $875,000 | $788,535 | $86,465 |
| 2021 | $3,515 | $268,570 | $175,761 | $92,809 |
| 2020 | $3,468 | $265,817 | $173,959 | $91,858 |
| 2019 | $3,403 | $260,605 | $170,548 | $90,057 |
| 2018 | $3,335 | $255,496 | $167,204 | $88,292 |
| 2017 | $3,288 | $250,487 | $163,926 | $86,561 |
| 2016 | $3,131 | $245,576 | $160,712 | $84,864 |
| 2015 | $3,086 | $241,888 | $158,298 | $83,590 |
| 2014 | $3,011 | $237,150 | $155,197 | $81,953 |
Source: Public Records
Map
Nearby Homes
- 14151 Lake St
- 14356 Taft St
- 14171 Flower St
- 10061 15th St
- 9906 13th St
- 10886 Lotus Dr
- 9884 11th St
- 13322 Euclid St
- 5317 Silver Dr
- 812 N Euclid St
- 14376 Euclid St Unit 1-4
- 5405 W 4th St
- 9936 Pear Dr
- 9851 Bolsa Ave Unit 198
- 9851 Bolsa Ave Unit 196
- 10632 Henderson Ave
- 13611 Glenhaven Dr
- 323 N Euclid St Unit 99
- 14362 Bushard St Unit 39
- 14362 Bushard St Unit 109
- 10382 Jennrich Ave
- 10362 Jennrich Ave
- 10371 Mcclure Ave
- 10381 Mcclure Ave
- 10402 Jennrich Ave
- 10356 Jennrich Ave
- 10361 Mcclure Ave
- 10401 Mcclure Ave
- 10381 Jennrich Ave
- 10371 Jennrich Ave
- 10412 Jennrich Ave
- 10352 Jennrich Ave
- 10351 Mcclure Ave
- 10391 Jennrich Ave
- 10357 Jennrich Ave
- 10411 Jennrich Ave
- 10351 Jennrich Ave
- 10341 Mcclure Ave
- 10422 Jennrich Ave
- 10332 Jennrich Ave