Estimated Value: $496,000 - $585,000
4
Beds
3
Baths
2,853
Sq Ft
$186/Sq Ft
Est. Value
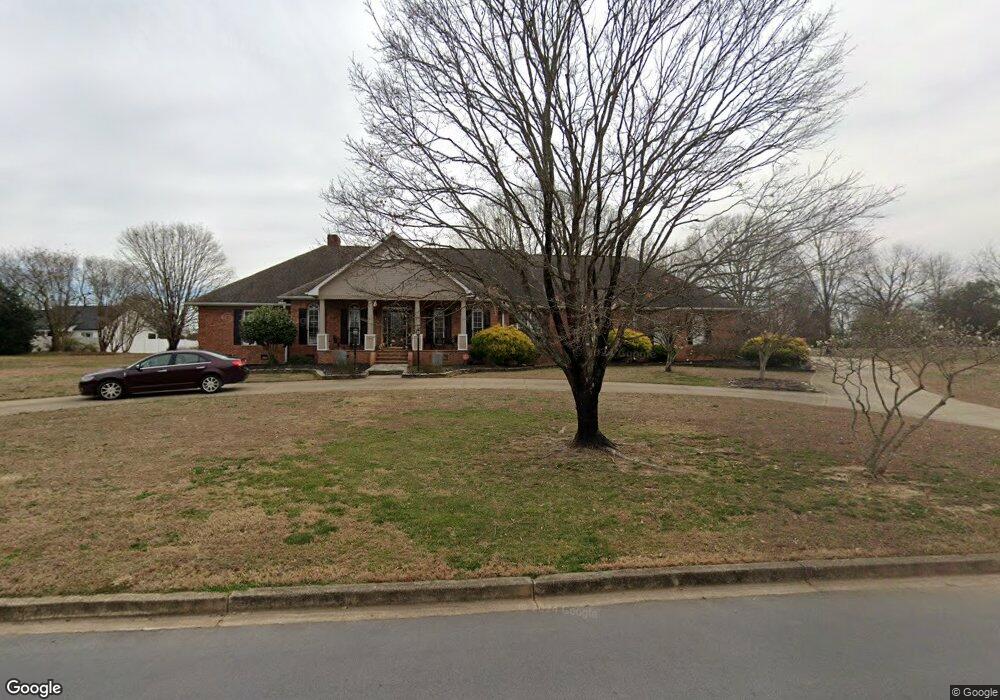
About This Home
This home is located at 104 Hymarke Dr, Moore, SC 29369 and is currently estimated at $531,584, approximately $186 per square foot. 104 Hymarke Dr is a home located in Spartanburg County with nearby schools including River Ridge Elementary School, Florence Chapel Middle School, and Berry Shoals Intermediate School.
Ownership History
Date
Name
Owned For
Owner Type
Purchase Details
Closed on
Feb 12, 2021
Sold by
Hall Phillip W and Hall Ruthanne
Bought by
Hall Phillip W and Hall Ruthanne J
Current Estimated Value
Purchase Details
Closed on
Mar 26, 2020
Sold by
Hall Doris R and Hall Phillip W
Bought by
Deshields Grant N and Deshields Loren A
Home Financials for this Owner
Home Financials are based on the most recent Mortgage that was taken out on this home.
Interest Rate
3.5%
Purchase Details
Closed on
May 9, 2019
Sold by
Hall Doris R Jolly and Hall Ruthanne
Bought by
Hall Phillip W and Hall Ruthanne J
Purchase Details
Closed on
Jun 22, 2011
Sold by
Jolly Jeffrey Lamar
Bought by
Hall Doris R Jolly and Hall Ruthanne
Purchase Details
Closed on
Feb 3, 2009
Sold by
Jolly Peggy P
Bought by
Hall Phillip W and Hall Ruthanne
Home Financials for this Owner
Home Financials are based on the most recent Mortgage that was taken out on this home.
Original Mortgage
$200,000
Interest Rate
5.23%
Mortgage Type
Purchase Money Mortgage
Create a Home Valuation Report for This Property
The Home Valuation Report is an in-depth analysis detailing your home's value as well as a comparison with similar homes in the area
Home Values in the Area
Average Home Value in this Area
Purchase History
| Date | Buyer | Sale Price | Title Company |
|---|---|---|---|
| Hall Phillip W | -- | None Available | |
| Hall Phillip W | -- | None Available | |
| Deshields Grant N | $6,000,000 | -- | |
| Hall Phillip W | -- | None Available | |
| Hall Doris R Jolly | -- | -- | |
| Hall Phillip W | $285,000 | -- |
Source: Public Records
Mortgage History
| Date | Status | Borrower | Loan Amount |
|---|---|---|---|
| Closed | Deshields Grant N | -- | |
| Previous Owner | Hall Phillip W | $200,000 |
Source: Public Records
Tax History Compared to Growth
Tax History
| Year | Tax Paid | Tax Assessment Tax Assessment Total Assessment is a certain percentage of the fair market value that is determined by local assessors to be the total taxable value of land and additions on the property. | Land | Improvement |
|---|---|---|---|---|
| 2025 | $1,824 | $12,710 | $2,158 | $10,552 |
| 2024 | $1,824 | $12,710 | $2,158 | $10,552 |
| 2023 | $1,824 | $12,710 | $2,158 | $10,552 |
| 2022 | $1,622 | $11,052 | $1,880 | $9,172 |
| 2021 | $1,622 | $11,052 | $1,880 | $9,172 |
| 2020 | $1,937 | $11,052 | $1,880 | $9,172 |
| 2019 | $1,932 | $10,772 | $1,600 | $9,172 |
| 2018 | $1,791 | $10,772 | $1,600 | $9,172 |
| 2017 | $1,794 | $10,720 | $1,600 | $9,120 |
| 2016 | $1,738 | $10,720 | $1,600 | $9,120 |
| 2015 | $1,668 | $10,720 | $1,600 | $9,120 |
| 2014 | $1,674 | $10,720 | $1,600 | $9,120 |
Source: Public Records
Map
Nearby Homes
- 503 Shadetree Ct
- 725 Wilson Ferry Rd
- 301 Bloomfield Ct
- 146 Morning Lake Dr
- 218 Windsong Way
- 131 Lauden Dr
- 135 Morning Lake Dr
- 213 Rexford Dr
- 412 Ashley Oaks Dr
- 423 Rexford Dr
- 445 Rexford Dr
- 2407 Capslock Ln
- 121 Twin Lakes Dr
- 361 Rexford Dr
- 106 Riverbank Ct
- 212 Farmington Ct
- 101 Plantation Dr
- 212 Whispering Pines Dr
- 875 Pleasant Falls Dr
- 974 Appalachian Dr
- 108 Hymarke Dr
- 105 Hymarke Dr
- 91 Saluda Rd
- 283 Wilson Ferry Rd
- 93 Rock Cove Ct
- 109 Hymarke Dr
- 101 Rock Cove Ct
- 228 Wilson Ferry Rd
- 112 Hymarke Dr
- 151 Vista Dr
- 89 Rock Cove Ct
- 729 Kingswood Valley Dr
- 113 Hymarke Dr
- 725 Kingswood Valley Dr
- 293 Wilson Ferry Rd
- 261 Wilson Ferry Rd
- 149 Vista Dr
- 105 Rock Cove Ct
- 739 Kingswood Valley Dr
- 721 Kingswood Valley Dr