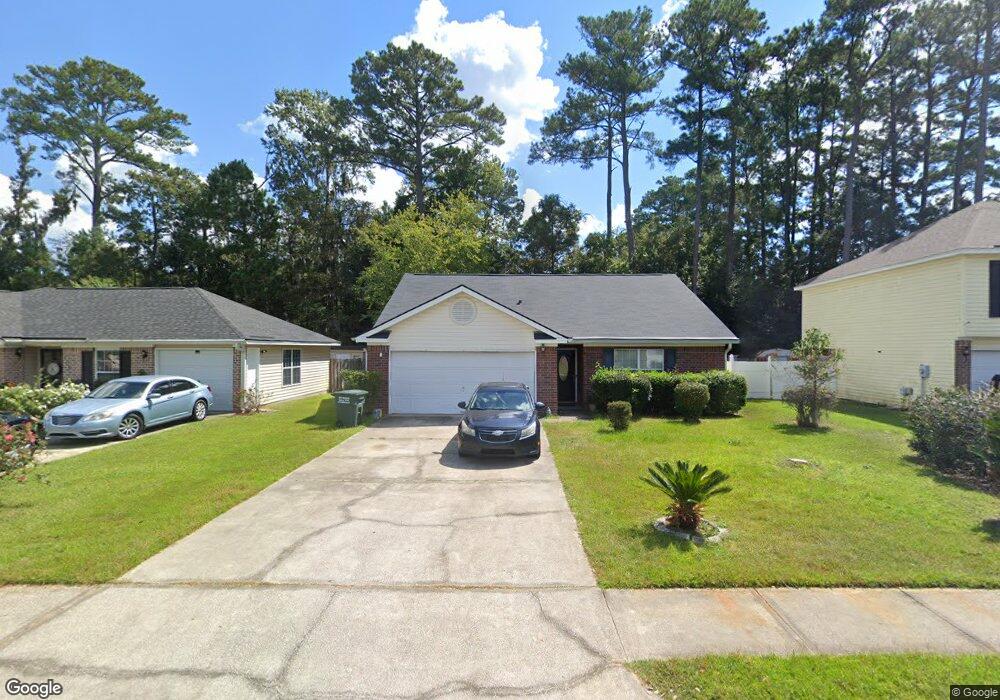
104 Mills Run Dr Savannah, GA 31405
Lamarville NeighborhoodEstimated Value: $252,000 - $274,000
4
Beds
2
Baths
1,340
Sq Ft
$198/Sq Ft
Est. Value
About This Home
This home is located at 104 Mills Run Dr, Savannah, GA 31405 and is currently estimated at $265,925, approximately $198 per square foot. 104 Mills Run Dr is a home located in Chatham County with nearby schools including Butler Elementary School, Derenne Middle School, and Beach High School.
Ownership History
Date
Name
Owned For
Owner Type
Purchase Details
Closed on
Dec 28, 2023
Sold by
Colley Letia L
Bought by
Plowden Jontae and Reid Ricardo
Current Estimated Value
Home Financials for this Owner
Home Financials are based on the most recent Mortgage that was taken out on this home.
Original Mortgage
$224,358
Outstanding Balance
$220,677
Interest Rate
7.29%
Mortgage Type
FHA
Estimated Equity
$45,248
Purchase Details
Closed on
Apr 6, 2016
Sold by
Ellis Letia L
Bought by
Colley Letia L and Colley Trohn
Home Financials for this Owner
Home Financials are based on the most recent Mortgage that was taken out on this home.
Original Mortgage
$87,550
Interest Rate
3.68%
Mortgage Type
VA
Purchase Details
Closed on
Sep 11, 2007
Sold by
Not Provided
Bought by
Ellis Letia L
Purchase Details
Closed on
Sep 23, 2004
Sold by
Jerry C Wardlaw Construction Inc
Bought by
Ellis Letia L
Create a Home Valuation Report for This Property
The Home Valuation Report is an in-depth analysis detailing your home's value as well as a comparison with similar homes in the area
Home Values in the Area
Average Home Value in this Area
Purchase History
| Date | Buyer | Sale Price | Title Company |
|---|---|---|---|
| Plowden Jontae | $245,000 | -- | |
| Colley Letia L | -- | -- | |
| Colley Letia L | -- | -- | |
| Ellis Letia L | -- | -- | |
| Ellis Letia L | $123,800 | -- |
Source: Public Records
Mortgage History
| Date | Status | Borrower | Loan Amount |
|---|---|---|---|
| Open | Colley Letia L | $224,358 | |
| Previous Owner | Colley Letia L | $87,550 |
Source: Public Records
Tax History Compared to Growth
Tax History
| Year | Tax Paid | Tax Assessment Tax Assessment Total Assessment is a certain percentage of the fair market value that is determined by local assessors to be the total taxable value of land and additions on the property. | Land | Improvement |
|---|---|---|---|---|
| 2025 | $4,525 | $91,880 | $18,000 | $73,880 |
| 2024 | $4,525 | $91,320 | $18,000 | $73,320 |
| 2023 | $1,330 | $78,440 | $12,800 | $65,640 |
| 2022 | $1,604 | $72,040 | $12,800 | $59,240 |
| 2021 | $1,706 | $57,440 | $12,800 | $44,640 |
| 2020 | $1,694 | $56,120 | $12,800 | $43,320 |
| 2019 | $1,804 | $59,800 | $12,800 | $47,000 |
| 2018 | $1,773 | $58,000 | $12,800 | $45,200 |
| 2017 | $1,742 | $58,360 | $12,800 | $45,560 |
| 2016 | $1,436 | $49,880 | $8,000 | $41,880 |
| 2015 | $1,282 | $43,360 | $8,000 | $35,360 |
| 2014 | -- | $46,720 | $0 | $0 |
Source: Public Records
Map
Nearby Homes
- 5805 Beverly St
- 105 Brandlewood Dr
- 2196 Fenwick Ave
- 19 Villas of Garrard Dr
- 5103 Garrard Ave
- 5011 Garrard Ave
- 43 Villas of Garrard Dr
- 6101 Garrard Ave
- 0 Sumter St Unit 325473
- 113 John Eady Ct
- 115 John Eady Ct
- 124 John Eady Ct
- 118 John Eady Ct
- 1741 Vassar St
- 1816 Tubman St
- 1721 Arcadian St
- 3808 Elmdale Ave
- 2003 Tuskegee St
- 1920 Mitchell St
- 1212 Myers St
- 106 Mills Run Dr
- 102 Mills Run Dr
- 108 Mills Run Dr
- 103 Mills Run Dr
- 110 Mills Run Dr
- 105 Mills Run Dr
- 101 Mills Run Dr
- 121 Blaine Ct
- 119 Blaine Ct
- 107 Mills Run Dr
- 117 Blaine Ct
- 109 Mills Run Dr
- 112 Mills Run Dr
- 2227 Louis Mills Blvd
- 123 Blaine Ct
- 115 Blaine Ct
- 111 Mills Run Dr
- 114 Mills Run Dr
- 13 Mills Run Ct
- 2019 Mills Run Dr