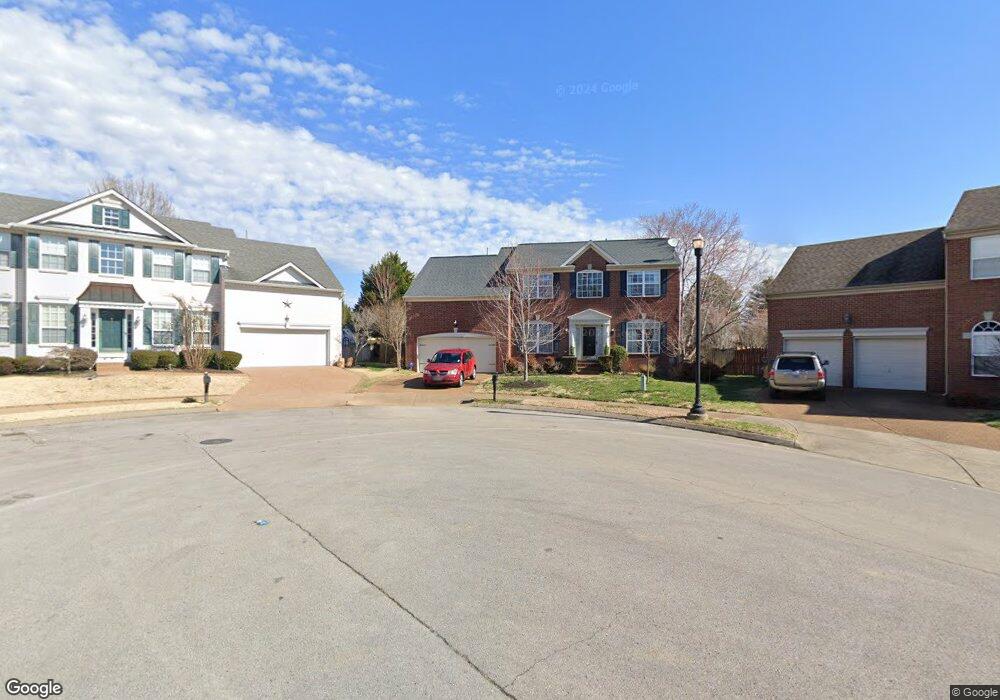
104 Rob Roy Ct Franklin, TN 37064
Carnton NeighborhoodEstimated Value: $674,022 - $739,000
Studio
3
Baths
2,324
Sq Ft
$305/Sq Ft
Est. Value
About This Home
This home is located at 104 Rob Roy Ct, Franklin, TN 37064 and is currently estimated at $708,756, approximately $304 per square foot. 104 Rob Roy Ct is a home located in Williamson County with nearby schools including Winstead Elementary School, Legacy Middle School, and Harpeth Montessori.
Ownership History
Date
Name
Owned For
Owner Type
Purchase Details
Closed on
Jul 24, 2009
Sold by
Thrasher Stanley C and Thrasher Anita
Bought by
Flores Laura W and Flores Marcos
Current Estimated Value
Home Financials for this Owner
Home Financials are based on the most recent Mortgage that was taken out on this home.
Original Mortgage
$200,000
Outstanding Balance
$130,930
Interest Rate
5.37%
Mortgage Type
New Conventional
Estimated Equity
$577,826
Purchase Details
Closed on
Nov 15, 2004
Sold by
Murray Mark K and Murray Lisa M
Bought by
Thrasher Stanley C and Thrasher Anita
Home Financials for this Owner
Home Financials are based on the most recent Mortgage that was taken out on this home.
Original Mortgage
$199,120
Interest Rate
5.65%
Mortgage Type
New Conventional
Purchase Details
Closed on
Mar 5, 1998
Sold by
Zaring Homes Inc
Bought by
Murray Mark K and Murray Larry
Home Financials for this Owner
Home Financials are based on the most recent Mortgage that was taken out on this home.
Original Mortgage
$160,500
Interest Rate
6.95%
Create a Home Valuation Report for This Property
The Home Valuation Report is an in-depth analysis detailing your home's value as well as a comparison with similar homes in the area
Home Values in the Area
Average Home Value in this Area
Purchase History
| Date | Buyer | Sale Price | Title Company |
|---|---|---|---|
| Flores Laura W | $280,000 | None Available | |
| Thrasher Stanley C | $248,900 | -- | |
| Murray Mark K | $206,900 | -- |
Source: Public Records
Mortgage History
| Date | Status | Borrower | Loan Amount |
|---|---|---|---|
| Open | Flores Laura W | $200,000 | |
| Previous Owner | Thrasher Stanley C | $199,120 | |
| Previous Owner | Murray Mark K | $160,500 | |
| Closed | Thrasher Stanley C | $49,780 |
Source: Public Records
Tax History
| Year | Tax Paid | Tax Assessment Tax Assessment Total Assessment is a certain percentage of the fair market value that is determined by local assessors to be the total taxable value of land and additions on the property. | Land | Improvement |
|---|---|---|---|---|
| 2025 | $2,318 | $170,225 | $50,000 | $120,225 |
| 2024 | $2,318 | $107,500 | $25,000 | $82,500 |
| 2023 | $2,318 | $107,500 | $25,000 | $82,500 |
| 2022 | $2,318 | $107,500 | $25,000 | $82,500 |
| 2021 | $2,318 | $107,500 | $25,000 | $82,500 |
| 2020 | $2,131 | $82,675 | $17,500 | $65,175 |
| 2019 | $2,131 | $82,675 | $17,500 | $65,175 |
| 2018 | $2,073 | $82,675 | $17,500 | $65,175 |
| 2017 | $2,056 | $82,675 | $17,500 | $65,175 |
| 2016 | $2,032 | $82,675 | $17,500 | $65,175 |
| 2015 | -- | $69,200 | $15,000 | $54,200 |
| 2014 | -- | $69,200 | $15,000 | $54,200 |
Source: Public Records
Map
Nearby Homes
- 298 Wisteria Dr
- 314 Larkspur Cove
- 2569 Winder Dr
- 403 Freesia Ct
- 2208 Bowman Rd
- 2268 Winder Cir
- 256 Wisteria Dr
- 2117 Tonya Ct
- 3013 Natures Landing Dr
- 170 Cavalry Dr
- 317 Julianna Cir
- 454 River Bluff Dr
- 137 Sontag Dr
- 1002 Shannon Ln
- 107 Tiffany Ct
- 1107 Gardner Dr
- 2207 Oakwood Ct
- 1251 Carriage Park Dr Unit 14A
- 1616 Kinnard Dr
- 2165 Summer Hill Cir
- 107 Rob Roy Ct
- 102 Rob Roy Ct
- 324 Braveheart Dr
- 105 Rob Roy Ct
- 100 Bluebell Way
- 102 Bluebell Way
- 323 Braveheart Dr
- 100 Rob Roy Ct
- 103 Rob Roy Ct
- 453 Mackenzie Way
- 448 Mackenzie Way
- 101 Rob Roy Ct
- 322 Braveheart Dr
- 101 Turnberry Dr
- 321 Braveheart Dr
- 108 Bluebell Way
- 449 Mackenzie Way
- 110 Bluebell Way
- 112 Bluebell Way
- 101 Bluebell Way
Your Personal Tour Guide
Ask me questions while you tour the home.