1040 Diamond Crest Ct Santa Barbara, CA 93110
East Goleta Valley NeighborhoodEstimated Value: $2,180,897 - $2,588,000
3
Beds
3
Baths
2,657
Sq Ft
$910/Sq Ft
Est. Value
About This Home
This home is located at 1040 Diamond Crest Ct, Santa Barbara, CA 93110 and is currently estimated at $2,416,724, approximately $909 per square foot. 1040 Diamond Crest Ct is a home located in Santa Barbara County with nearby schools including Hollister Elementary School, La Colina Junior High School, and San Marcos Senior High School.
Ownership History
Date
Name
Owned For
Owner Type
Purchase Details
Closed on
Jan 13, 2022
Sold by
2020 Sarmiento Revocable Trust
Bought by
2020 Sarmiento Revocable Trust
Current Estimated Value
Home Financials for this Owner
Home Financials are based on the most recent Mortgage that was taken out on this home.
Original Mortgage
$995,000
Outstanding Balance
$914,222
Interest Rate
2.88%
Mortgage Type
New Conventional
Estimated Equity
$1,502,502
Purchase Details
Closed on
Jan 5, 2021
Sold by
Sarmiento Carlo R and Sarmiento Susan
Bought by
Sarmiento Carlo and Sarmiento Susan
Purchase Details
Closed on
Feb 2, 1994
Sold by
Koke Edward and Koke Debra Lee
Bought by
Sarmiento Carlo R and Sarmiento Susan
Home Financials for this Owner
Home Financials are based on the most recent Mortgage that was taken out on this home.
Original Mortgage
$352,000
Interest Rate
3.5%
Create a Home Valuation Report for This Property
The Home Valuation Report is an in-depth analysis detailing your home's value as well as a comparison with similar homes in the area
Home Values in the Area
Average Home Value in this Area
Purchase History
| Date | Buyer | Sale Price | Title Company |
|---|---|---|---|
| 2020 Sarmiento Revocable Trust | -- | Fidelity National Title | |
| Sarmiento Carlo | -- | None Available | |
| Sarmiento Carlo R | $440,000 | Stewart Title |
Source: Public Records
Mortgage History
| Date | Status | Borrower | Loan Amount |
|---|---|---|---|
| Open | 2020 Sarmiento Revocable Trust | $995,000 | |
| Previous Owner | Sarmiento Carlo R | $352,000 |
Source: Public Records
Tax History Compared to Growth
Tax History
| Year | Tax Paid | Tax Assessment Tax Assessment Total Assessment is a certain percentage of the fair market value that is determined by local assessors to be the total taxable value of land and additions on the property. | Land | Improvement |
|---|---|---|---|---|
| 2025 | $8,244 | $747,842 | $356,923 | $390,919 |
| 2023 | $8,244 | $718,804 | $343,064 | $375,740 |
| 2022 | $7,983 | $704,711 | $336,338 | $368,373 |
| 2021 | $7,855 | $690,894 | $329,744 | $361,150 |
| 2020 | $7,655 | $683,810 | $326,363 | $357,447 |
| 2019 | $7,520 | $670,403 | $319,964 | $350,439 |
| 2018 | $7,365 | $657,259 | $313,691 | $343,568 |
| 2017 | $7,235 | $644,373 | $307,541 | $336,832 |
| 2016 | $7,016 | $631,739 | $301,511 | $330,228 |
| 2014 | $6,863 | $610,063 | $291,166 | $318,897 |
Source: Public Records
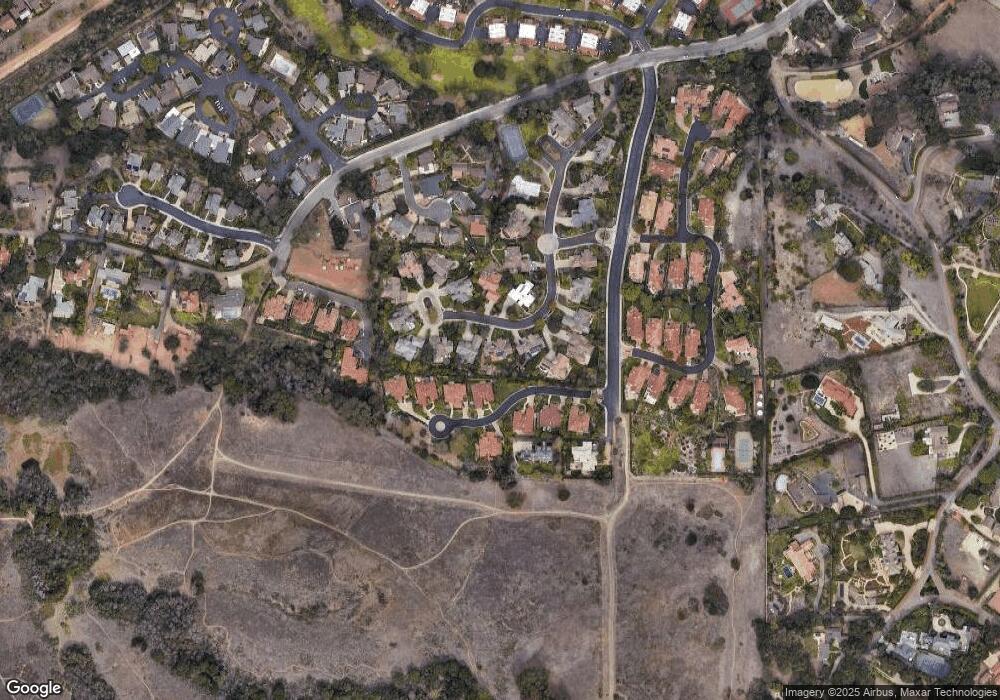
Map
Nearby Homes
- 1048 Diamond Crest Ct
- 4760 Calle Camarada
- 4672 Via Roblada
- 4560 Via Esperanza
- 4558 Via Esperanza
- 0 More Mesa Dr
- 339 Via El Encantador
- 4689 Puente Plaza
- 740 Walnut Ln
- 4517 Vieja Dr
- 5085 Amberly Place
- 5019 Whitney Ct
- 4490 Via Alegre
- 4817 San Gordiano Ave
- 161 La Venta Dr
- 4450 Via Alegre
- 5295-3 Shoreline Dr
- 5295 Shoreline Dr
- 691 Via Trepadora
- 4265 Cresta Ave
- 4750 Calle Las Brisas
- 1015 Diamond Crest Ct
- 1086 Diamond Crest Ct
- 1030 Diamond Crest Ct
- 4754 Calle Las Brisas
- 1045 Diamond Crest Ct
- 1054 Diamond Crest Ct
- 4745 Calle Las Brisas
- 4760 Calle Las Brisas
- 1024 Diamond Crest Ct
- 1020 Diamond Crest Ct
- 4739 Calle Las Brisas
- 4749 Calle Las Brisas
- 1005 Diamond Crest
- 1005 Diamond Crest Ct
- 1074 Diamond Crest 1weup769bttb
- 1060 Diamond Crest
- 1074 Diamond Crest
- 1060 Diamond Crest Ct
- 1074 Diamond Crest Ct