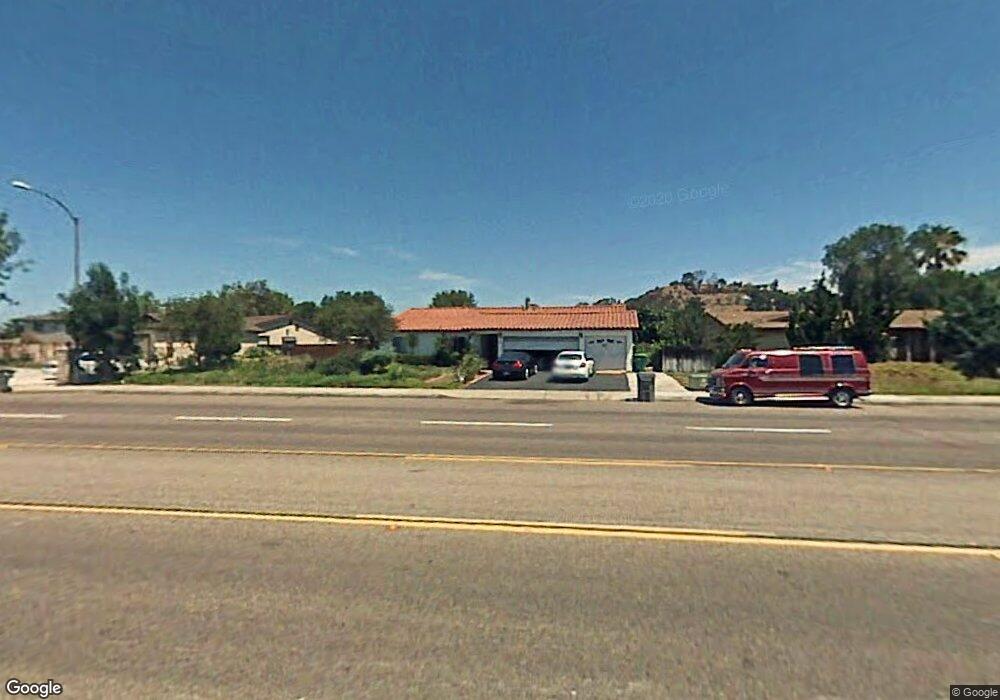
1044 E Chase Ave El Cajon, CA 92020
Estimated Value: $929,815 - $1,278,000
4
Beds
2
Baths
1,855
Sq Ft
$568/Sq Ft
Est. Value
About This Home
This home is located at 1044 E Chase Ave, El Cajon, CA 92020 and is currently estimated at $1,053,704, approximately $568 per square foot. 1044 E Chase Ave is a home located in San Diego County with nearby schools including Anza Elementary School, Cajon Valley Middle School, and Valhalla High.
Ownership History
Date
Name
Owned For
Owner Type
Purchase Details
Closed on
Jun 28, 2023
Sold by
Odish Samer H
Bought by
Samer H Odish Living Trust and Odish
Current Estimated Value
Purchase Details
Closed on
Nov 20, 1996
Sold by
Odish Sahira H
Bought by
Odish Samer H
Home Financials for this Owner
Home Financials are based on the most recent Mortgage that was taken out on this home.
Original Mortgage
$130,000
Interest Rate
7.86%
Purchase Details
Closed on
May 3, 1995
Sold by
Kasshmoun Khalid
Bought by
Odish Sahira H
Home Financials for this Owner
Home Financials are based on the most recent Mortgage that was taken out on this home.
Original Mortgage
$124,000
Interest Rate
7.9%
Purchase Details
Closed on
Jun 15, 1989
Create a Home Valuation Report for This Property
The Home Valuation Report is an in-depth analysis detailing your home's value as well as a comparison with similar homes in the area
Home Values in the Area
Average Home Value in this Area
Purchase History
| Date | Buyer | Sale Price | Title Company |
|---|---|---|---|
| Samer H Odish Living Trust | -- | None Listed On Document | |
| Odish Samer H | -- | South Coast Title Company | |
| Odish Sahira H | -- | Gateway Title Company | |
| -- | $198,500 | -- |
Source: Public Records
Mortgage History
| Date | Status | Borrower | Loan Amount |
|---|---|---|---|
| Previous Owner | Odish Samer H | $130,000 | |
| Previous Owner | Odish Sahira H | $124,000 | |
| Closed | Odish Samer H | $13,000 |
Source: Public Records
Tax History
| Year | Tax Paid | Tax Assessment Tax Assessment Total Assessment is a certain percentage of the fair market value that is determined by local assessors to be the total taxable value of land and additions on the property. | Land | Improvement |
|---|---|---|---|---|
| 2025 | $4,129 | $284,992 | $97,706 | $187,286 |
| 2024 | $4,129 | $279,405 | $95,791 | $183,614 |
| 2023 | $3,983 | $273,927 | $93,913 | $180,014 |
| 2022 | $3,938 | $268,557 | $92,072 | $176,485 |
| 2021 | $4,005 | $263,292 | $90,267 | $173,025 |
| 2020 | $3,789 | $260,593 | $89,342 | $171,251 |
| 2019 | $3,060 | $255,485 | $87,591 | $167,894 |
| 2018 | $3,009 | $250,476 | $85,874 | $164,602 |
| 2017 | $31 | $245,566 | $84,191 | $161,375 |
| 2016 | $2,849 | $240,752 | $82,541 | $158,211 |
| 2015 | $2,834 | $237,137 | $81,302 | $155,835 |
| 2014 | $2,778 | $232,493 | $79,710 | $152,783 |
Source: Public Records
Map
Nearby Homes
- 1115 S Mollison Ave
- 851 S Mollison Ave
- 975-89 S Lincoln Ave
- 1449 Bernita Way
- 749 S Mollison Ave Unit 27
- 663 Ruby St
- 410 S 1st St Unit 30
- 410 S 1st St Unit 94
- 410 S 1st St Unit 157
- 410 S 1st St Unit 156
- 410 S 1st St Unit 158
- 410 S 1st St Unit 185
- 410 S 1st St Unit 131
- 410 S 1st St Unit 199
- 1160 E Washington Ave Unit 3
- 5346 Grandridge Rd
- 655 E Washington Ave Unit J
- 716 S 2nd St Unit 177
- 716 S 2nd St Unit 194
- 716 S 2nd St Unit 197
- 1056 E Chase Ave
- 1032 E Chase Ave
- 1030 E Chase Ave
- 1098 Glenhill Rd
- 1086 Glenhill Rd
- 1074 Glenhill Rd
- 1051 E Chase Ave
- 1091 S Anza St
- 1029 E Chase Ave
- 1083 S Anza St
- 1062 Glenhill Rd
- 1122 Fernhill Way
- 1099 Glenhill Rd
- 1001 E Chase Ave
- 1083 Glenhill Rd
- 1050 Glenhill Rd
- 1010 Old Chase Ave
- 1077 Glenhill Rd
- 1048 Glenhill Rd
- 1065 Glenhill Rd