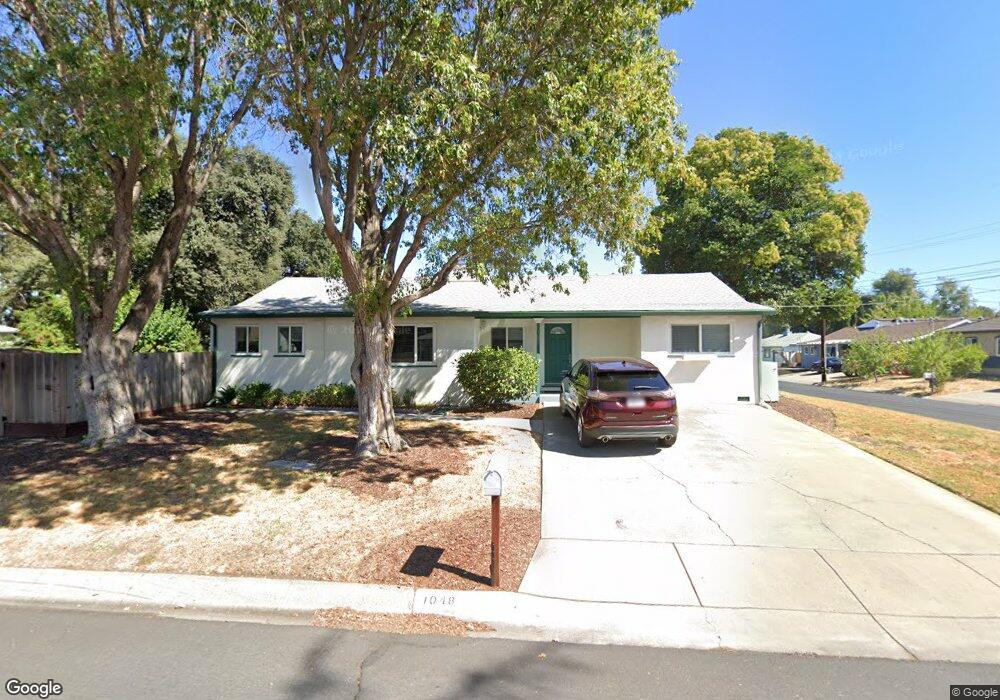
1048 Ernst Way Concord, CA 94518
Tree Haven NeighborhoodEstimated Value: $715,000 - $828,000
3
Beds
1
Bath
1,615
Sq Ft
$473/Sq Ft
Est. Value
About This Home
This home is located at 1048 Ernst Way, Concord, CA 94518 and is currently estimated at $763,782, approximately $472 per square foot. 1048 Ernst Way is a home located in Contra Costa County with nearby schools including Ygnacio Valley Elementary School, Oak Grove Middle School, and Ygnacio Valley High School.
Ownership History
Date
Name
Owned For
Owner Type
Purchase Details
Closed on
Sep 14, 2000
Sold by
Allen Head Earl and Allen Renee Karan
Bought by
Trtek John E and Trtek Ruth E
Current Estimated Value
Home Financials for this Owner
Home Financials are based on the most recent Mortgage that was taken out on this home.
Original Mortgage
$207,200
Outstanding Balance
$74,875
Interest Rate
7.98%
Mortgage Type
Purchase Money Mortgage
Estimated Equity
$688,907
Purchase Details
Closed on
Jun 12, 1998
Sold by
Looney Grice Hazel
Bought by
Head Earl Allen and Head Karan Renee
Home Financials for this Owner
Home Financials are based on the most recent Mortgage that was taken out on this home.
Original Mortgage
$130,150
Interest Rate
7.11%
Mortgage Type
Purchase Money Mortgage
Create a Home Valuation Report for This Property
The Home Valuation Report is an in-depth analysis detailing your home's value as well as a comparison with similar homes in the area
Home Values in the Area
Average Home Value in this Area
Purchase History
| Date | Buyer | Sale Price | Title Company |
|---|---|---|---|
| Trtek John E | $259,000 | Old Republic Title Company | |
| Head Earl Allen | -- | American Title Co |
Source: Public Records
Mortgage History
| Date | Status | Borrower | Loan Amount |
|---|---|---|---|
| Open | Trtek John E | $207,200 | |
| Previous Owner | Head Earl Allen | $130,150 | |
| Closed | Trtek John E | $21,800 |
Source: Public Records
Tax History
| Year | Tax Paid | Tax Assessment Tax Assessment Total Assessment is a certain percentage of the fair market value that is determined by local assessors to be the total taxable value of land and additions on the property. | Land | Improvement |
|---|---|---|---|---|
| 2025 | $5,241 | $390,249 | $158,206 | $232,043 |
| 2024 | $4,989 | $382,598 | $155,104 | $227,494 |
| 2023 | $4,989 | $375,097 | $152,063 | $223,034 |
| 2022 | $4,909 | $367,743 | $149,082 | $218,661 |
| 2021 | $4,778 | $360,533 | $146,159 | $214,374 |
| 2019 | $4,677 | $349,841 | $141,825 | $208,016 |
| 2018 | $4,493 | $342,983 | $139,045 | $203,938 |
| 2017 | $4,335 | $336,259 | $136,319 | $199,940 |
| 2016 | $4,201 | $329,667 | $133,647 | $196,020 |
| 2015 | $4,138 | $324,716 | $131,640 | $193,076 |
| 2014 | $3,874 | $302,500 | $122,634 | $179,866 |
Source: Public Records
Map
Nearby Homes
- 1459 Del Rio Cir Unit C
- 1800 Gilardy Dr
- 1040 Mohr Ln Unit C
- 1035 Heckmann Ln
- 1044 Mohr Ln Unit D
- 1391 Monument Blvd Unit 20
- 1045 Mohr Ln Unit B
- 1110 Eureka Ln
- 1387 Del Rio Cir Unit D
- 1049 Mohr Ln Unit A
- 1369 Del Rio Cir Unit D
- 1369 Del Rio Cir Unit C
- 1064 Mohr Ln Unit C
- 1134 Lovell Ct
- 1360 Del Rio Ct Unit 4
- 1013 Mohr Ln Unit 2
- 1078 Mohr Ln Unit A
- 2005 Sierra Rd
- 1156 Carey Dr
- 1036 Oak Grove Rd Unit 23
- 1411 Orange St
- 1050 Ernst Way
- 1049 Ernst Way
- 1431 Orange St
- 1360 Orange St
- 1380 Orange St
- 1051 Ernst Way
- 1049 Larry Place
- 1340 Orange St
- 1052 Ernst Way
- 1331 Orange St
- 1400 Orange St
- 1451 Orange St
- 1051 Larry Place
- 1390 Rosemary Ln
- 1320 Orange St
- 1420 Orange St
- 1053 Ernst Way
- 1311 Orange St
- 1054 Ernst Way
Your Personal Tour Guide
Ask me questions while you tour the home.