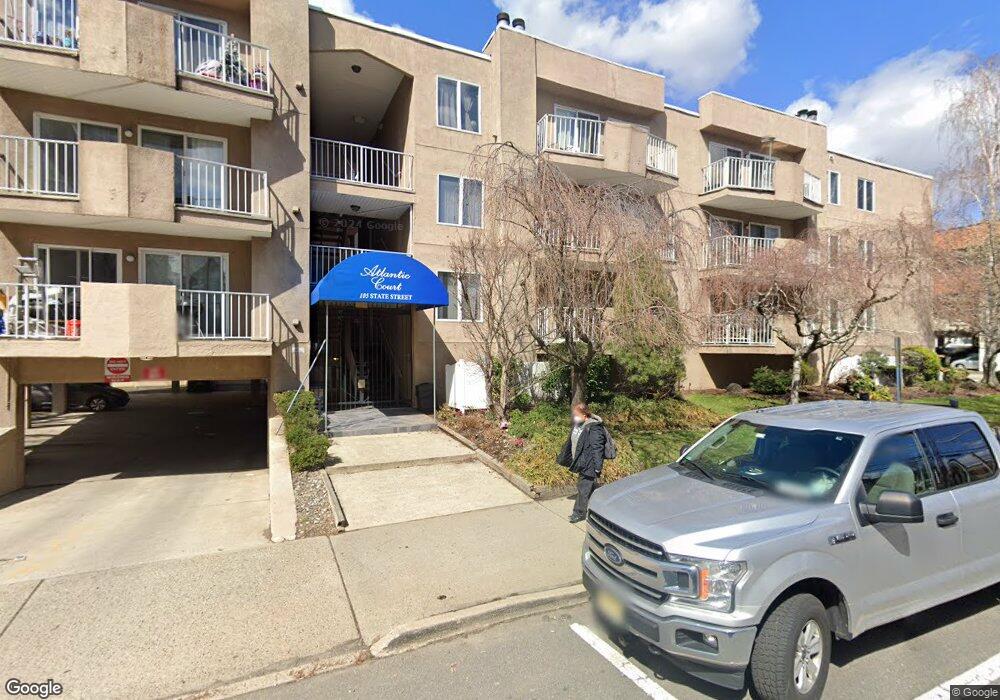
105 State St Unit 17 Hackensack, NJ 07601
Estimated Value: $322,746 - $379,000
Studio
--
Bath
834
Sq Ft
$428/Sq Ft
Est. Value
About This Home
This home is located at 105 State St Unit 17, Hackensack, NJ 07601 and is currently estimated at $356,687, approximately $427 per square foot. 105 State St Unit 17 is a home located in Bergen County with nearby schools including Hackensack High School, Bergen County Christian Academy, and George Washington School.
Ownership History
Date
Name
Owned For
Owner Type
Purchase Details
Closed on
Nov 19, 2021
Sold by
Park John and Park Minjung
Bought by
Remache Guillermo E Gomez
Current Estimated Value
Home Financials for this Owner
Home Financials are based on the most recent Mortgage that was taken out on this home.
Original Mortgage
$229,500
Outstanding Balance
$208,710
Interest Rate
3.05%
Mortgage Type
New Conventional
Estimated Equity
$147,977
Purchase Details
Closed on
Nov 16, 2006
Sold by
Park Min Jung and Park John
Bought by
Dead Of Trust
Purchase Details
Closed on
Jun 6, 2005
Sold by
Nazario Jason
Bought by
Park John and Park Minjung
Home Financials for this Owner
Home Financials are based on the most recent Mortgage that was taken out on this home.
Original Mortgage
$190,800
Interest Rate
5.78%
Purchase Details
Closed on
Jul 12, 1999
Sold by
Chase Manhattan Mtg Corp
Bought by
Loughran Eilish
Home Financials for this Owner
Home Financials are based on the most recent Mortgage that was taken out on this home.
Original Mortgage
$58,400
Interest Rate
7.5%
Purchase Details
Closed on
Jul 9, 1999
Sold by
Federal National Mortgage Association
Bought by
Chase Manhattan Mtg Corp
Home Financials for this Owner
Home Financials are based on the most recent Mortgage that was taken out on this home.
Original Mortgage
$58,400
Interest Rate
7.5%
Create a Home Valuation Report for This Property
The Home Valuation Report is an in-depth analysis detailing your home's value as well as a comparison with similar homes in the area
Home Values in the Area
Average Home Value in this Area
Purchase History
| Date | Buyer | Sale Price | Title Company |
|---|---|---|---|
| Remache Guillermo E Gomez | $255,000 | Belmont Ttl & Stlmt Svcs Llc | |
| Dead Of Trust | -- | None Listed On Document | |
| Dead Of Trust | -- | None Listed On Document | |
| Park John | $238,500 | -- | |
| Loughran Eilish | $73,000 | Vested Title Inc | |
| Chase Manhattan Mtg Corp | -- | Vested Title Inc |
Source: Public Records
Mortgage History
| Date | Status | Borrower | Loan Amount |
|---|---|---|---|
| Open | Remache Guillermo E Gomez | $229,500 | |
| Previous Owner | Park John | $190,800 | |
| Previous Owner | Loughran Eilish | $58,400 |
Source: Public Records
Tax History
| Year | Tax Paid | Tax Assessment Tax Assessment Total Assessment is a certain percentage of the fair market value that is determined by local assessors to be the total taxable value of land and additions on the property. | Land | Improvement |
|---|---|---|---|---|
| 2025 | $7,252 | $237,300 | $102,500 | $134,800 |
| 2024 | $6,832 | $237,300 | $102,500 | $134,800 |
| 2023 | $6,428 | $237,300 | $102,500 | $134,800 |
| 2022 | $6,428 | $229,400 | $98,000 | $131,400 |
| 2021 | $6,434 | $191,600 | $86,000 | $105,600 |
| 2020 | $6,340 | $191,600 | $86,000 | $105,600 |
| 2019 | $6,227 | $185,500 | $81,000 | $104,500 |
| 2018 | $5,747 | $168,400 | $80,000 | $88,400 |
| 2017 | $5,379 | $157,500 | $70,000 | $87,500 |
| 2016 | $5,793 | $171,500 | $85,000 | $86,500 |
| 2015 | $6,129 | $175,100 | $57,800 | $117,300 |
| 2014 | $5,817 | $175,100 | $57,800 | $117,300 |
Source: Public Records
Map
Nearby Homes
- 72 Lawrence St
- 75 Union St Unit 5E
- 84 Kansas St
- 99 Kansas St
- 113 Kansas St
- 115 Kansas St
- 168 Clay St Unit 70
- 54 Polifly Rd Unit 201
- 150 Overlook Ave Unit 10H
- 150 Overlook Ave Unit 7F
- 150 Overlook Ave Unit 12E
- 301 Beech St Unit 10I
- 301 Beech St Unit 2B
- 363 Park St
- 160 Overlook Ave Unit 3A
- 160 Overlook Ave Unit 16C
- 160 Overlook Ave Unit 4C
- 90 Prospect Ave Unit 2A
- 90 Prospect Ave Unit 9B
- 115 Polifly Rd Unit 5D
- 105 State St Unit C0022
- 105 State St
- 105 State St
- 105 State St Unit 20
- 105 State St
- 105 State St Unit 14
- 105 State St Unit 13
- 105 State St Unit 10
- 105 State St Unit 6
- 105 State St
- 105 State St
- 105 State St
- 105 State St
- 105 State St
- 105 State St
- 105 State St
- 105 State St
- 105 State St Unit 2A
- 105 State St
- 105 State St
Your Personal Tour Guide
Ask me questions while you tour the home.