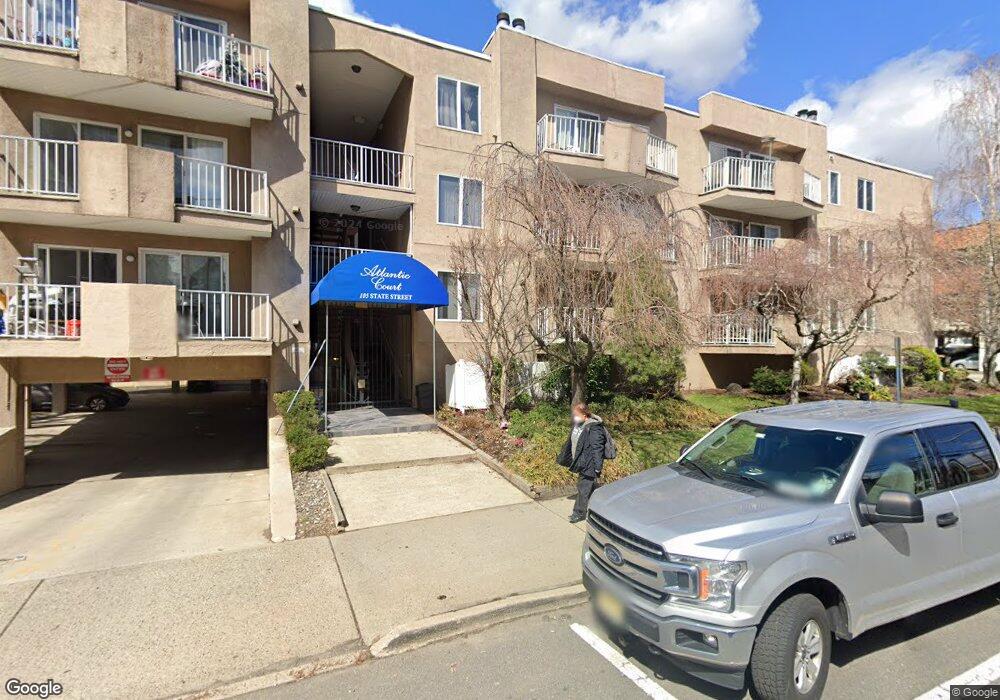
105 State St Hackensack, NJ 07601
Estimated Value: $345,614 - $388,000
Studio
--
Bath
962
Sq Ft
$385/Sq Ft
Est. Value
About This Home
This home is located at 105 State St, Hackensack, NJ 07601 and is currently estimated at $370,654, approximately $385 per square foot. 105 State St is a home located in Bergen County with nearby schools including Hackensack High School, Bergen County Christian Academy, and George Washington School.
Ownership History
Date
Name
Owned For
Owner Type
Purchase Details
Closed on
Jul 25, 2001
Sold by
Mirasol Maria R
Bought by
Lao Melani L
Current Estimated Value
Home Financials for this Owner
Home Financials are based on the most recent Mortgage that was taken out on this home.
Original Mortgage
$135,000
Outstanding Balance
$51,874
Interest Rate
7.1%
Estimated Equity
$318,780
Purchase Details
Closed on
Oct 12, 2000
Sold by
Atlantic Ent
Bought by
Mirasol Maria Rochi
Home Financials for this Owner
Home Financials are based on the most recent Mortgage that was taken out on this home.
Original Mortgage
$96,772
Interest Rate
7.83%
Mortgage Type
FHA
Purchase Details
Closed on
Nov 14, 1996
Sold by
Tinsley Diane
Bought by
Tinsley Diane and Harrison Barry
Purchase Details
Closed on
Apr 1, 1994
Sold by
Atlantic Enterprises
Bought by
Tinsley Diane
Home Financials for this Owner
Home Financials are based on the most recent Mortgage that was taken out on this home.
Original Mortgage
$98,000
Interest Rate
7.7%
Create a Home Valuation Report for This Property
The Home Valuation Report is an in-depth analysis detailing your home's value as well as a comparison with similar homes in the area
Home Values in the Area
Average Home Value in this Area
Purchase History
| Date | Buyer | Sale Price | Title Company |
|---|---|---|---|
| Lao Melani L | $150,000 | -- | |
| Mirasol Maria Rochi | $99,000 | -- | |
| Tinsley Diane | $60,000 | -- | |
| Tinsley Diane | $105,000 | -- |
Source: Public Records
Mortgage History
| Date | Status | Borrower | Loan Amount |
|---|---|---|---|
| Open | Lao Melani L | $135,000 | |
| Previous Owner | Mirasol Maria Rochi | $96,772 | |
| Previous Owner | Tinsley Diane | $98,000 |
Source: Public Records
Tax History
| Year | Tax Paid | Tax Assessment Tax Assessment Total Assessment is a certain percentage of the fair market value that is determined by local assessors to be the total taxable value of land and additions on the property. | Land | Improvement |
|---|---|---|---|---|
| 2025 | $7,548 | $247,000 | $102,500 | $144,500 |
| 2024 | $7,111 | $247,000 | $102,500 | $144,500 |
| 2023 | $6,792 | $247,000 | $102,500 | $144,500 |
| 2022 | $6,792 | $242,400 | $98,000 | $144,400 |
| 2021 | $6,783 | $202,000 | $86,000 | $116,000 |
| 2020 | $6,684 | $202,000 | $86,000 | $116,000 |
| 2019 | $6,576 | $195,900 | $81,000 | $114,900 |
| 2018 | $6,044 | $177,100 | $80,000 | $97,100 |
| 2017 | $5,672 | $166,100 | $70,000 | $96,100 |
| 2016 | $6,084 | $180,100 | $85,000 | $95,100 |
| 2015 | $6,566 | $187,600 | $61,900 | $125,700 |
| 2014 | $6,232 | $187,600 | $61,900 | $125,700 |
Source: Public Records
Map
Nearby Homes
- 72 Lawrence St
- 75 Union St Unit 5E
- 84 Kansas St
- 99 Kansas St
- 113 Kansas St
- 115 Kansas St
- 168 Clay St Unit 70
- 54 Polifly Rd Unit 201
- 150 Overlook Ave Unit 10H
- 150 Overlook Ave Unit 7F
- 150 Overlook Ave Unit 12E
- 301 Beech St Unit 10I
- 301 Beech St Unit 2B
- 363 Park St
- 160 Overlook Ave Unit 3A
- 160 Overlook Ave Unit 16C
- 160 Overlook Ave Unit 4C
- 90 Prospect Ave Unit 2A
- 90 Prospect Ave Unit 9B
- 115 Polifly Rd Unit 5D
- 105 State St Unit C0022
- 105 State St
- 105 State St
- 105 State St Unit 20
- 105 State St Unit 14
- 105 State St Unit 13
- 105 State St Unit 10
- 105 State St Unit 17
- 105 State St Unit 6
- 105 State St
- 105 State St
- 105 State St
- 105 State St
- 105 State St
- 105 State St
- 105 State St
- 105 State St
- 105 State St Unit 2A
- 105 State St
- 105 State St
Your Personal Tour Guide
Ask me questions while you tour the home.