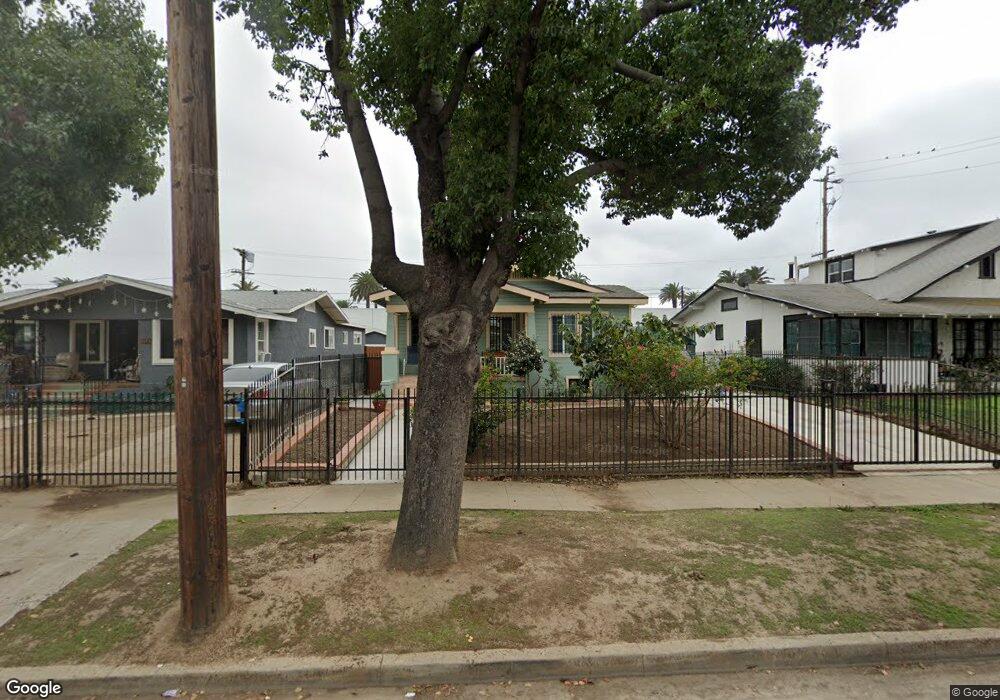
1050 W 78th St Los Angeles, CA 90044
Vermont Knolls NeighborhoodEstimated Value: $582,000 - $713,000
2
Beds
1
Bath
977
Sq Ft
$656/Sq Ft
Est. Value
About This Home
This home is located at 1050 W 78th St, Los Angeles, CA 90044 and is currently estimated at $640,710, approximately $655 per square foot. 1050 W 78th St is a home located in Los Angeles County with nearby schools including Raymond Avenue Elementary School, John Muir Middle School, and Augustus F. Hawkins High A Critical Design And Gaming.
Ownership History
Date
Name
Owned For
Owner Type
Purchase Details
Closed on
Jan 27, 2009
Sold by
Jpmc Specialty Mortgage Llc
Bought by
Alfaro Jose Raul
Current Estimated Value
Home Financials for this Owner
Home Financials are based on the most recent Mortgage that was taken out on this home.
Original Mortgage
$157,102
Outstanding Balance
$99,201
Interest Rate
5.08%
Mortgage Type
FHA
Estimated Equity
$541,509
Purchase Details
Closed on
Apr 29, 2008
Sold by
Johnson Melissa
Bought by
Wm Specialty Mortgage Llc
Purchase Details
Closed on
Aug 21, 2006
Sold by
Johnson Melissa
Bought by
Equitable Solution Enterprises Llc
Purchase Details
Closed on
Mar 10, 2003
Sold by
Chesley Llc
Bought by
Johnson Melissa
Home Financials for this Owner
Home Financials are based on the most recent Mortgage that was taken out on this home.
Original Mortgage
$189,900
Interest Rate
7.99%
Purchase Details
Closed on
Jul 11, 2002
Sold by
Mcnutt Fonda and Maiden Sandra
Bought by
Chesley Llc
Create a Home Valuation Report for This Property
The Home Valuation Report is an in-depth analysis detailing your home's value as well as a comparison with similar homes in the area
Home Values in the Area
Average Home Value in this Area
Purchase History
| Date | Buyer | Sale Price | Title Company |
|---|---|---|---|
| Alfaro Jose Raul | $160,000 | Chicago Title Company | |
| Wm Specialty Mortgage Llc | $283,950 | Cr Title Services Inc | |
| Equitable Solution Enterprises Llc | -- | None Available | |
| Johnson Melissa | $190,000 | Equity Title | |
| Chesley Llc | $104,283 | Equity Title Company |
Source: Public Records
Mortgage History
| Date | Status | Borrower | Loan Amount |
|---|---|---|---|
| Open | Alfaro Jose Raul | $157,102 | |
| Previous Owner | Johnson Melissa | $189,900 |
Source: Public Records
Tax History Compared to Growth
Tax History
| Year | Tax Paid | Tax Assessment Tax Assessment Total Assessment is a certain percentage of the fair market value that is determined by local assessors to be the total taxable value of land and additions on the property. | Land | Improvement |
|---|---|---|---|---|
| 2025 | $2,701 | $206,026 | $164,825 | $41,201 |
| 2024 | $2,701 | $201,988 | $161,594 | $40,394 |
| 2023 | $2,656 | $198,028 | $158,426 | $39,602 |
| 2022 | $2,543 | $194,146 | $155,320 | $38,826 |
| 2021 | $2,507 | $190,340 | $152,275 | $38,065 |
| 2019 | $2,438 | $184,696 | $147,759 | $36,937 |
| 2018 | $2,356 | $181,075 | $144,862 | $36,213 |
| 2016 | $2,250 | $174,045 | $139,238 | $34,807 |
| 2015 | $2,220 | $171,432 | $137,147 | $34,285 |
| 2014 | $2,238 | $168,075 | $134,461 | $33,614 |
Source: Public Records
Map
Nearby Homes
- 1122 W 77th St
- 7705 S Vermont Ave
- 7515 S Vermont Ave
- 945 W 76th St
- 1217 W 77th St
- 945 W 75th St
- 944 W 74th St
- 844 W 78th St
- 847 W 81st St
- 7819 S Hoover St
- 1037 W 83rd St
- 820 W 80th St
- 823 W 81st St
- 7427 S Hoover St
- 924 W 82nd St
- 815 W 74th St
- 726 W 76th St
- 727 W 76th St
- 8106 S Normandie Ave
- 1250 W 83rd St