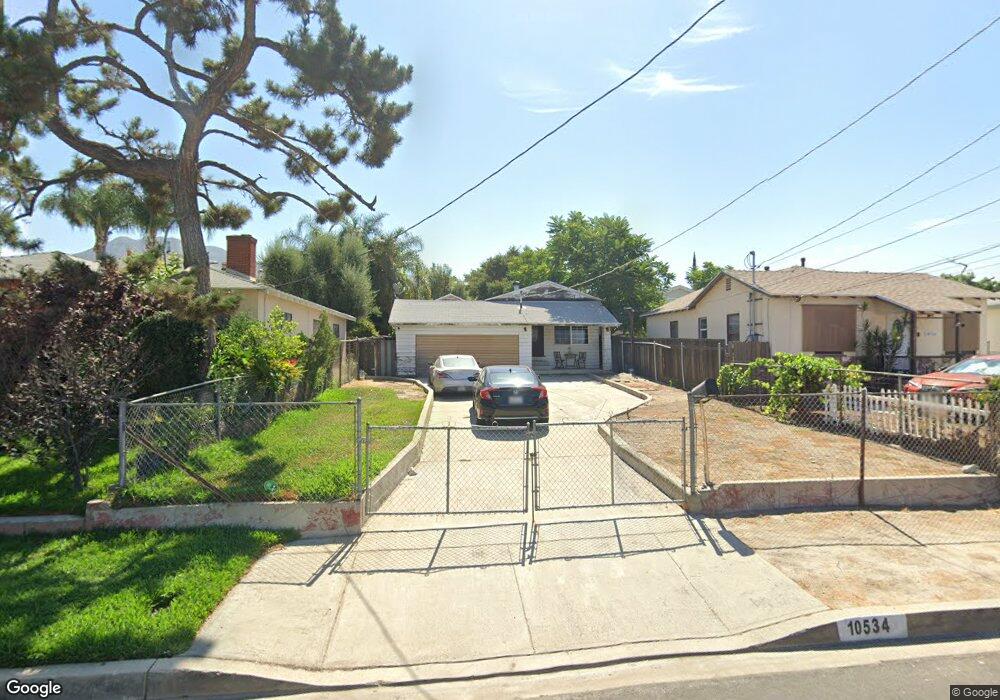
10534 Langmuir Ave Sunland, CA 91040
Sunland NeighborhoodEstimated Value: $578,000 - $730,000
2
Beds
2
Baths
885
Sq Ft
$740/Sq Ft
Est. Value
About This Home
This home is located at 10534 Langmuir Ave, Sunland, CA 91040 and is currently estimated at $654,521, approximately $739 per square foot. 10534 Langmuir Ave is a home located in Los Angeles County with nearby schools including Sunland Elementary School, Mt. Gleason Middle School, and Verdugo Hills Senior High School.
Ownership History
Date
Name
Owned For
Owner Type
Purchase Details
Closed on
Mar 17, 2017
Sold by
Gomez Quintero J
Bought by
Gomez Jane A
Current Estimated Value
Purchase Details
Closed on
Jul 14, 1994
Sold by
Federal Home Loan Mortgage Corporation
Bought by
Quintero J Manuel and Quintero Jane Aliana
Home Financials for this Owner
Home Financials are based on the most recent Mortgage that was taken out on this home.
Original Mortgage
$102,600
Interest Rate
5.62%
Purchase Details
Closed on
Jun 7, 1994
Sold by
Coast Federal Bank Fsb
Bought by
Federal Home Loan Mortgage Corporation
Home Financials for this Owner
Home Financials are based on the most recent Mortgage that was taken out on this home.
Original Mortgage
$102,600
Interest Rate
5.62%
Purchase Details
Closed on
Dec 29, 1993
Sold by
Coast Fed Services
Bought by
Coast Federal Bank Fsb
Create a Home Valuation Report for This Property
The Home Valuation Report is an in-depth analysis detailing your home's value as well as a comparison with similar homes in the area
Home Values in the Area
Average Home Value in this Area
Purchase History
| Date | Buyer | Sale Price | Title Company |
|---|---|---|---|
| Gomez Jane A | -- | None Available | |
| Quintero J Manuel | $108,000 | World Title Company | |
| Federal Home Loan Mortgage Corporation | -- | World Title Company | |
| Coast Federal Bank Fsb | $111,000 | Chicago Title Company |
Source: Public Records
Mortgage History
| Date | Status | Borrower | Loan Amount |
|---|---|---|---|
| Previous Owner | Quintero J Manuel | $102,600 |
Source: Public Records
Tax History Compared to Growth
Tax History
| Year | Tax Paid | Tax Assessment Tax Assessment Total Assessment is a certain percentage of the fair market value that is determined by local assessors to be the total taxable value of land and additions on the property. | Land | Improvement |
|---|---|---|---|---|
| 2025 | $2,706 | $211,607 | $127,640 | $83,967 |
| 2024 | $2,706 | $207,459 | $125,138 | $82,321 |
| 2023 | $2,656 | $203,392 | $122,685 | $80,707 |
| 2022 | $2,536 | $199,405 | $120,280 | $79,125 |
| 2021 | $2,502 | $195,496 | $117,922 | $77,574 |
| 2019 | $2,430 | $189,699 | $114,425 | $75,274 |
| 2018 | $2,346 | $185,981 | $112,182 | $73,799 |
| 2016 | $2,235 | $178,761 | $107,827 | $70,934 |
| 2015 | $2,203 | $176,077 | $106,208 | $69,869 |
| 2014 | $2,219 | $172,629 | $104,128 | $68,501 |
Source: Public Records
Map
Nearby Homes
- 10623 Woodward Ave
- 10430 Mcvine Ave
- 10429 Mcvine Ave
- 7851 Fenwick St
- 10415 Mcvine Ave Unit 2
- 8230 Hillrose St
- 10414 Whitegate Ave
- 10529 Mount Gleason Ave
- 7961 Apperson St
- 10404 Jardine Ave
- 10300 Whitegate Ave
- 7961 Day St
- 7848 Forsythe St
- 8352 Wyngate St
- 10704 Oro Vista Ave
- 8421 Grenoble St
- 10335 Oro Vista Ave
- 7755 Forsythe St
- 7755 Day St
- 10250 Quill Ave
- 10538 Langmuir Ave
- 10530 Langmuir Ave
- 10528 Langmuir Ave
- 10526 Langmuir Ave
- 10542 Langmuir Ave
- 10535 Rhodesia Ave
- 10539 Rhodesia Ave
- 10522 Langmuir Ave
- 10544 Langmuir Ave
- 10531 Rhodesia Ave
- 10543 Rhodesia Ave
- 10535 Langmuir Ave
- 10525 Rhodesia Ave
- 10531 Langmuir Ave
- 10539 Langmuir Ave
- 10518 Langmuir Ave
- 10547 Rhodesia Ave
- 10527 Langmuir Ave
- 10523 Langmuir Ave
- 10519 Rhodesia Ave