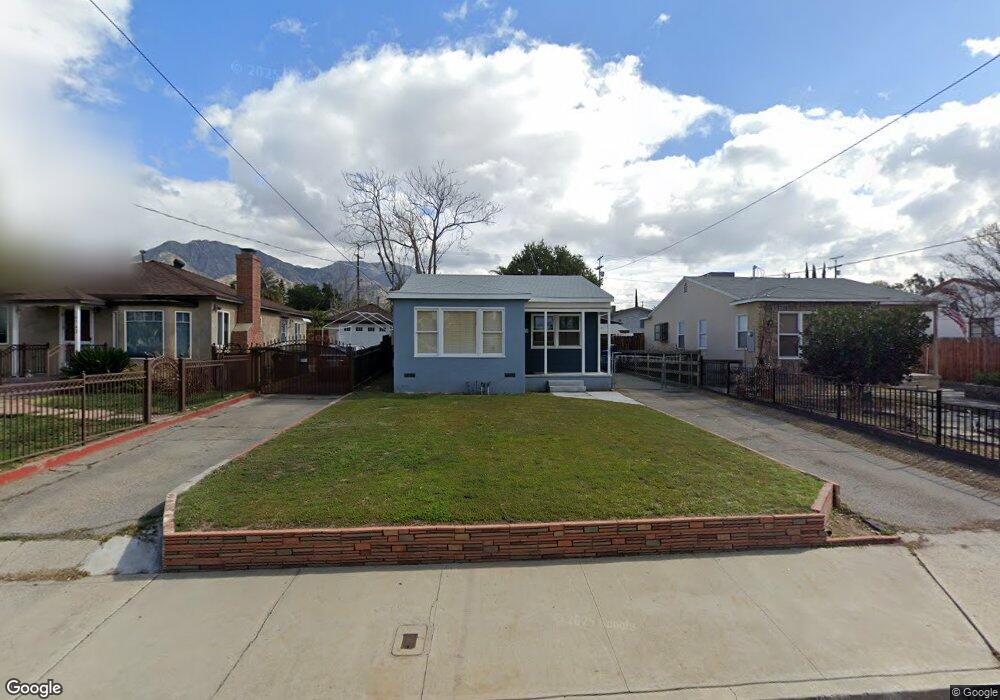
10538 Mather Ave Sunland, CA 91040
Sunland NeighborhoodEstimated Value: $610,000 - $642,551
2
Beds
1
Bath
805
Sq Ft
$776/Sq Ft
Est. Value
About This Home
This home is located at 10538 Mather Ave, Sunland, CA 91040 and is currently estimated at $624,638, approximately $775 per square foot. 10538 Mather Ave is a home located in Los Angeles County with nearby schools including Sunland Elementary School, Mt. Gleason Middle School, and Verdugo Hills Senior High School.
Ownership History
Date
Name
Owned For
Owner Type
Purchase Details
Closed on
May 20, 2010
Sold by
Bunt Deborah A
Bought by
Bunt Deborah A
Current Estimated Value
Home Financials for this Owner
Home Financials are based on the most recent Mortgage that was taken out on this home.
Original Mortgage
$170,000
Outstanding Balance
$113,833
Interest Rate
5.03%
Mortgage Type
New Conventional
Estimated Equity
$510,805
Purchase Details
Closed on
Sep 6, 2008
Sold by
Bunt Gregory J and Bunt Deborah A
Bought by
Bunt Deborah A
Purchase Details
Closed on
Aug 16, 2007
Sold by
Bunt Gregory J and Bunt Deborah A
Bought by
Bunt Deborah A
Purchase Details
Closed on
Nov 7, 2001
Sold by
Bunt Deborah A
Bought by
Bunt Gregory J and Bunt Deborah A
Home Financials for this Owner
Home Financials are based on the most recent Mortgage that was taken out on this home.
Original Mortgage
$93,000
Interest Rate
6.62%
Purchase Details
Closed on
May 18, 1994
Sold by
Banks Scott S and Banks Linda A
Bought by
Bunt Deborah A
Home Financials for this Owner
Home Financials are based on the most recent Mortgage that was taken out on this home.
Original Mortgage
$93,800
Interest Rate
8.56%
Create a Home Valuation Report for This Property
The Home Valuation Report is an in-depth analysis detailing your home's value as well as a comparison with similar homes in the area
Home Values in the Area
Average Home Value in this Area
Purchase History
| Date | Buyer | Sale Price | Title Company |
|---|---|---|---|
| Bunt Deborah A | -- | Lsi Local Solutions | |
| Bunt Deborah A | -- | None Available | |
| Bunt Deborah A | -- | None Available | |
| Bunt Gregory J | -- | Chicago Title | |
| Bunt Deborah A | $134,000 | Gateway Title |
Source: Public Records
Mortgage History
| Date | Status | Borrower | Loan Amount |
|---|---|---|---|
| Open | Bunt Deborah A | $170,000 | |
| Closed | Bunt Gregory J | $93,000 | |
| Closed | Bunt Deborah A | $93,800 |
Source: Public Records
Tax History Compared to Growth
Tax History
| Year | Tax Paid | Tax Assessment Tax Assessment Total Assessment is a certain percentage of the fair market value that is determined by local assessors to be the total taxable value of land and additions on the property. | Land | Improvement |
|---|---|---|---|---|
| 2025 | $2,790 | $227,723 | $129,666 | $98,057 |
| 2024 | $2,790 | $223,259 | $127,124 | $96,135 |
| 2023 | $2,737 | $218,882 | $124,632 | $94,250 |
| 2022 | $2,610 | $214,591 | $122,189 | $92,402 |
| 2021 | $2,575 | $210,385 | $119,794 | $90,591 |
| 2019 | $2,497 | $204,147 | $116,242 | $87,905 |
| 2018 | $2,427 | $200,145 | $113,963 | $86,182 |
| 2016 | $2,310 | $192,376 | $109,539 | $82,837 |
| 2015 | $2,276 | $189,487 | $107,894 | $81,593 |
| 2014 | $2,290 | $185,776 | $105,781 | $79,995 |
Source: Public Records
Map
Nearby Homes
- 10623 Woodward Ave
- 10430 Mcvine Ave
- 10429 Mcvine Ave
- 7851 Fenwick St
- 10415 Mcvine Ave Unit 2
- 8230 Hillrose St
- 10414 Whitegate Ave
- 10529 Mount Gleason Ave
- 7961 Apperson St
- 10404 Jardine Ave
- 10300 Whitegate Ave
- 7961 Day St
- 7848 Forsythe St
- 8352 Wyngate St
- 10704 Oro Vista Ave
- 8421 Grenoble St
- 10335 Oro Vista Ave
- 7755 Forsythe St
- 7755 Day St
- 10250 Quill Ave
- 10534 Mather Ave
- 10542 Mather Ave
- 10530 Mather Ave
- 10539 Langmuir Ave
- 10535 Langmuir Ave
- 10526 Mather Ave
- 10547 Langmuir Ave
- 10531 Langmuir Ave
- 10543 Mather Ave
- 10535 Mather Ave
- 10524 Mather Ave
- 10551 Langmuir Ave
- 10527 Langmuir Ave
- 10531 Mather Ave
- 10547 Mather Ave
- 10527 Mather Ave
- 10555 Langmuir Ave
- 10551 Mather Ave
- 10523 Langmuir Ave
- 10554 Mather Ave